
Reason to trust
How Our News is Made
Strict editorial policy that focuses on accuracy, relevance, and impartiality
Ad discliamer
Morbi pretium leo et nisl aliquam mollis. Quisque arcu lorem, ultricies quis pellentesque nec, ullamcorper eu odio.
Key Points
- Bitcoin cash price remained below the $200 resistance and corrected lower against the US Dollar.
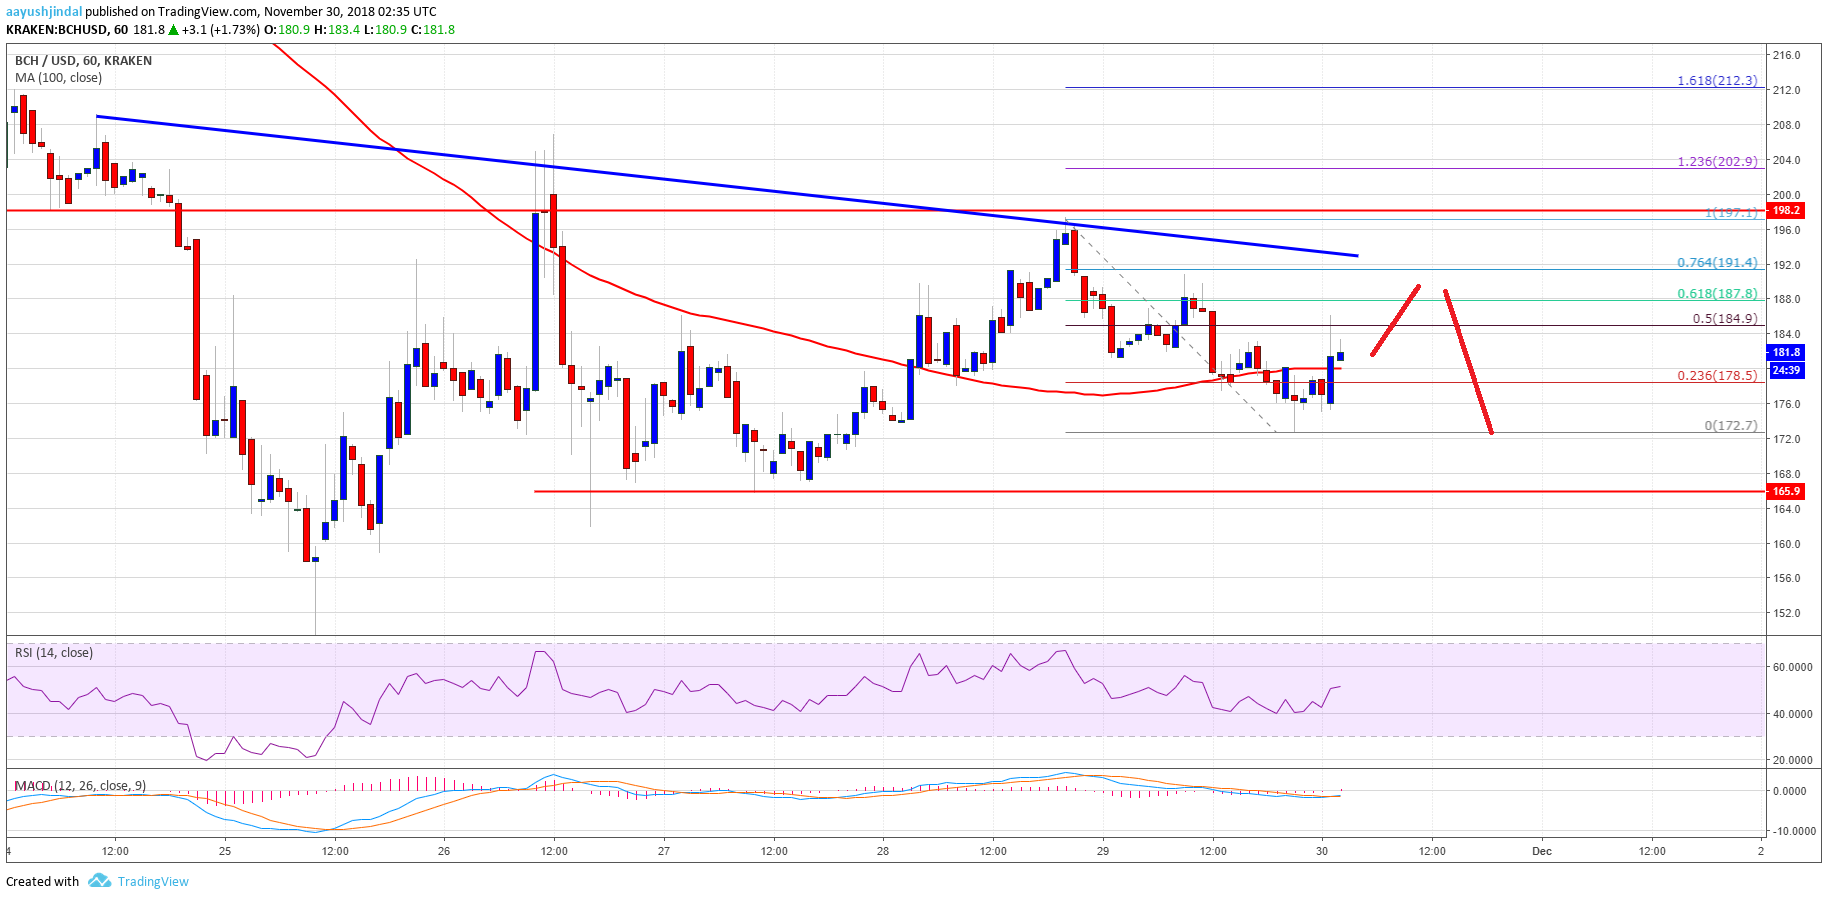
- There is a major bearish trend line formed with resistance near $193 on the hourly chart of the BCH/USD pair (data feed from Kraken).
- The pair could consolidate in the short term below $195 and $200 before the next move.
Bitcoin cash price remained in a range below the $200 resistance against the US Dollar. BCH/USD must climb above $190 and $200 to climb further higher in the near term.
Bitcoin Cash Price Analysis
Yesterday, we saw a rejection in bitcoin cash price near the $195-200 resistance zone against the US Dollar. The BCH/USD pair corrected lower and traded below the $180 level. It tested the $165 support area and formed a base for the next move. The price climbed higher and retested the $195-200 zone where sellers appeared. There was a fresh decline recently and the price traded towards the $170 level.
A new intraday low was formed at $172 and later the price corrected higher. It moved above the 23.6% Fib retracement level of the recent decline from the $197 high to $172 low. There was also a close above the $180 level and the 100 hourly simple moving average. However, there are many resistances on the upside near the $188 and $190 levels. There is also a major bearish trend line formed with resistance near $193 on the hourly chart of the BCH/USD pair. Below the trend line, the 61.8% Fib retracement level of the recent decline from the $197 high to $172 low is also a hurdle.
Looking at the chart, BCH price seems to be consolidating below the $200 resistance. On the downside, the key support is at $165, below which the price may test $150.
Looking at the technical indicators:
Hourly MACD – The MACD for BCH/USD is slowly moving in the bullish zone.
Hourly RSI (Relative Strength Index) – The RSI for BCH/USD is just above the 50 level.
Major Support Level – $165
Major Resistance Level – $195