
Reason to trust
How Our News is Made
Strict editorial policy that focuses on accuracy, relevance, and impartiality
Ad discliamer
Morbi pretium leo et nisl aliquam mollis. Quisque arcu lorem, ultricies quis pellentesque nec, ullamcorper eu odio.
Key Points
- Bitcoin price struggled to break the $4,120 resistance area and declined against the US Dollar.
- Yesterday’s highlighted crucial bearish trend line is active with resistance at $3,900 on the hourly chart of the BTC/USD pair (data feed from Kraken).
- The price is likely to struggle to clear the $3,900 and $4,000 resistance levels in the near term.
Bitcoin price remained below the $4,000 barrier against the US Dollar. BTC/USD could decline below $3,600 if it fails to move above the $4,000 barrier.
Bitcoin Price Analysis
Yesterday, we saw a short term upside move above $3,600 and $3,800 in bitcoin price against the US Dollar. The BTC/USD pair traded above the $4,000 barrier as well, but it failed to hold gains. The price was rejected near the $4,100 barrier and the 100 hourly simple moving average. It seems like buyers struggled to gain strength above $4,000, resulting in a bearish reaction.
A high was formed at $4,126 and later the price declined below $4,000 and $3,900. The decline was such that the price even broke the $3,580 support and traded as low as $3,513. Later, it corrected above $3,600 and the 23.6% Fib retracement level of the recent drop from the $4,126 high to $3,513 low. On the upside, there are many hurdles for buyers near the $3,800 and $3,900 levels. Moreover, yesterday’s highlighted crucial bearish trend line is active with resistance at $3,900 on the hourly chart of the BTC/USD pair. The 50% Fib retracement level of the recent drop from the $4,126 high to $3,513 low is also near $3,819.
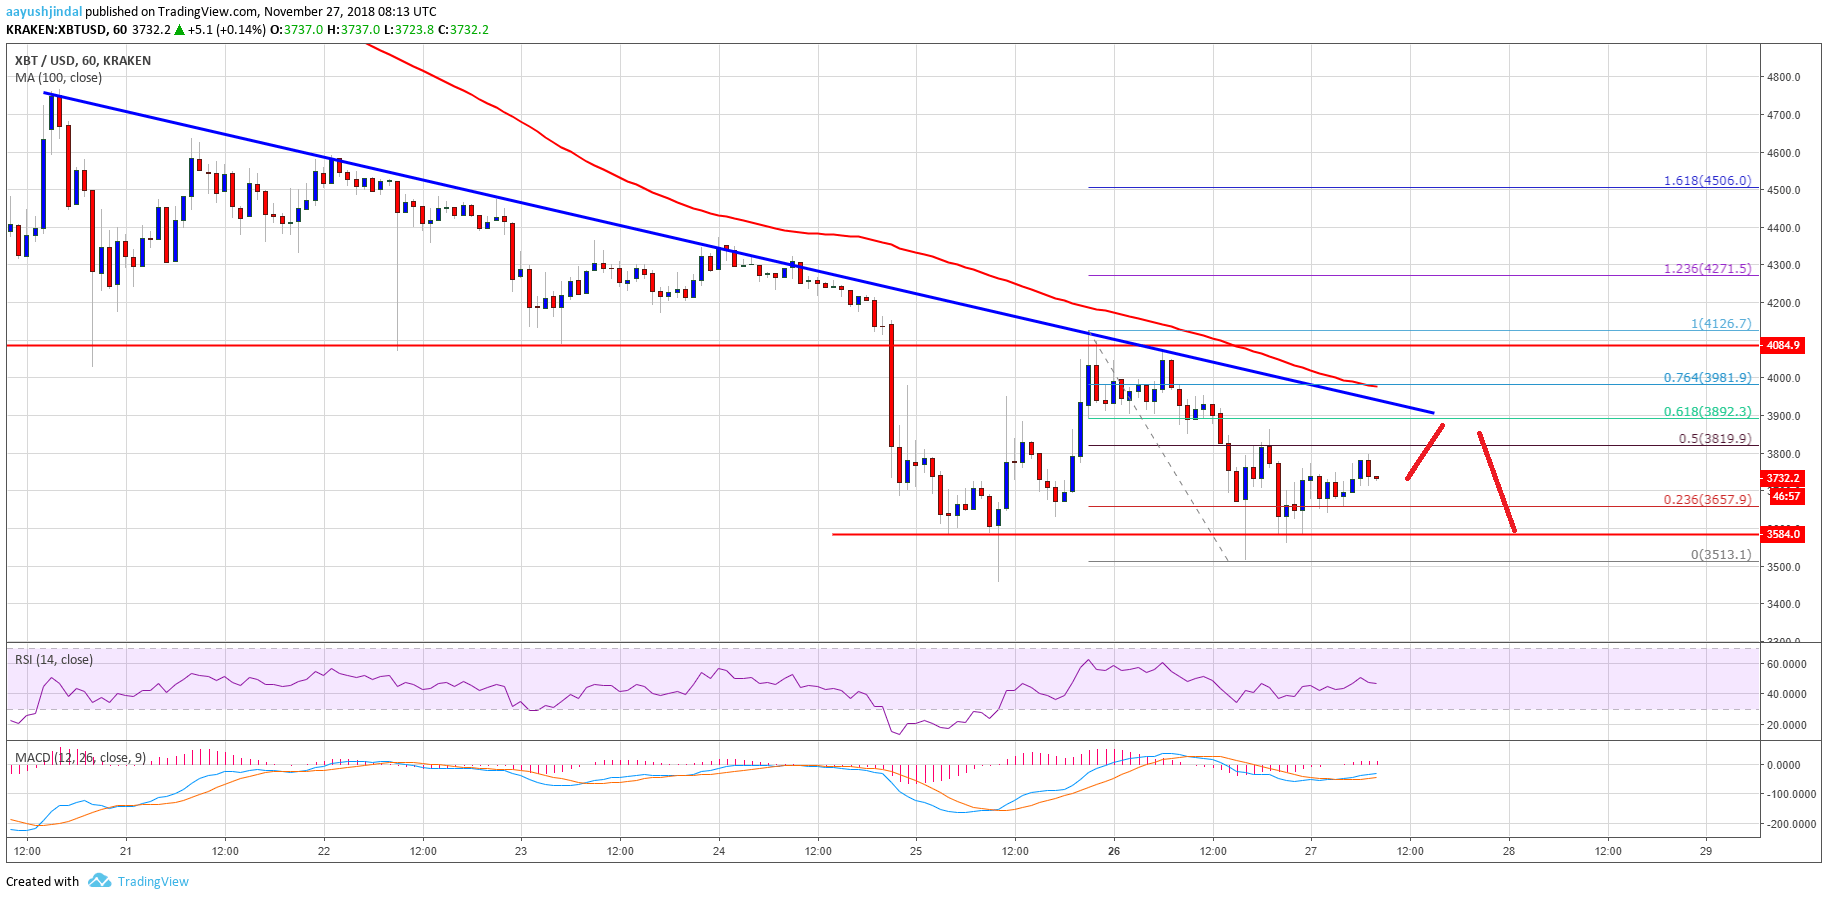
Looking at the chart, bitcoin price is clearly facing an uphill task near the $3,900 and $4,000 levels. If there is no convincing break above $4,000, the price could decline towards the $3,600 and $3,500 levels.
Looking at the technical indicators:
Hourly MACD – The MACD for BTC/USD is slightly placed in the bullish zone.
Hourly RSI (Relative Strength Index) – The RSI is currently just near the 50 level.
Major Support Level – $3,600
Major Resistance Level – $4,000