Key Highlights
- ADA price fell sharply and declined below the $0.0600 and $0.0500 support levels against the US Dollar (tethered).
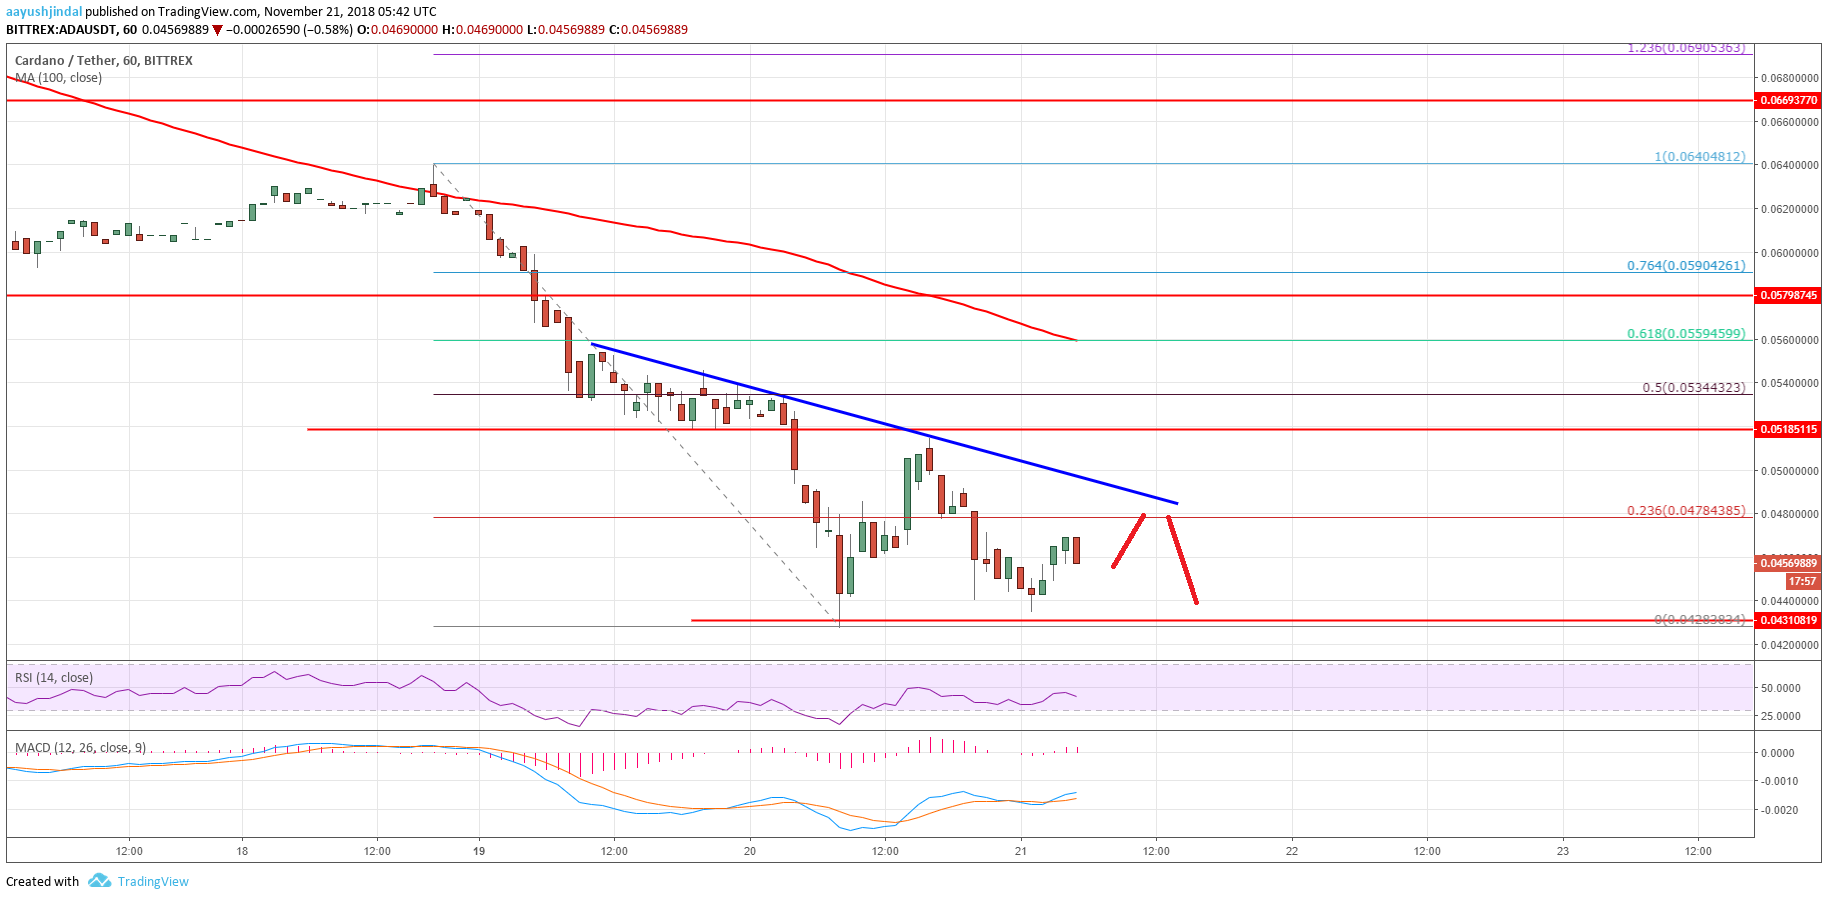
- There is a major bearish trend line formed with resistance at $0.0490 on the hourly chart of the ADA/USD pair (data feed via Bittrex).
- The pair is currently trading well below the $0.0500 support and it could decline further.
Cardano price declined below key supports against the US Dollar and Bitcoin. ADA/USD may correct higher, but it could face sellers near $0.049 and $0.050.
Cardano Price Analysis
During the past two days, there were continuous declines in cardano price below the $0.0750 support against the US Dollar. The ADA/USD pair fell sharply and traded below the $0.0600 and $0.0500 support levels. The decline was such that the price even broke the $0.0450 support zone. A low was formed at $0.0428 and the price is currently trading well below the 100 hourly simple moving average.
A short term consolidation is underway above the $0.0430 level. An initial resistance is $0.0470 and the 23.6% Fibonacci retracement level of the recent decline from the $0.0640 high to $0.0428 low. Moreover, there is a major bearish trend line formed with resistance at $0.0490 on the hourly chart of the ADA/USD pair. Above the trend line, the next resistance is at $0.0500. If buyers push the price above $0.0500, there could be a recovery towards the $0.0530 level. It represents the 50% Fibonacci retracement level of the recent decline from the $0.0640 high to $0.0428 low. On the downside, an initial support is at $0.0440, below which the price could slide below the $0.0428 low.

The chart indicates that ADA price is under a lot of pressure below the $0.0500 level. There could be a short term correction, but upsides are likely to be capped near $0.0490 or $0.0500.
Hourly MACD – The MACD for ADA/USD is placed slightly in the bearish zone.
Hourly RSI – The RSI for ADA/USD is currently below the 45 level.
Major Support Level – $0.0440
Major Resistance Level – $0.0500


