Reason to trust

How Our News is Made
Strict editorial policy that focuses on accuracy, relevance, and impartiality
Ad discliamer
Morbi pretium leo et nisl aliquam mollis. Quisque arcu lorem, ultricies quis pellentesque nec, ullamcorper eu odio.
Key Highlights
- ADA price fell sharply and traded below the $0.0700 and $0.065 supports against the US Dollar (tethered).
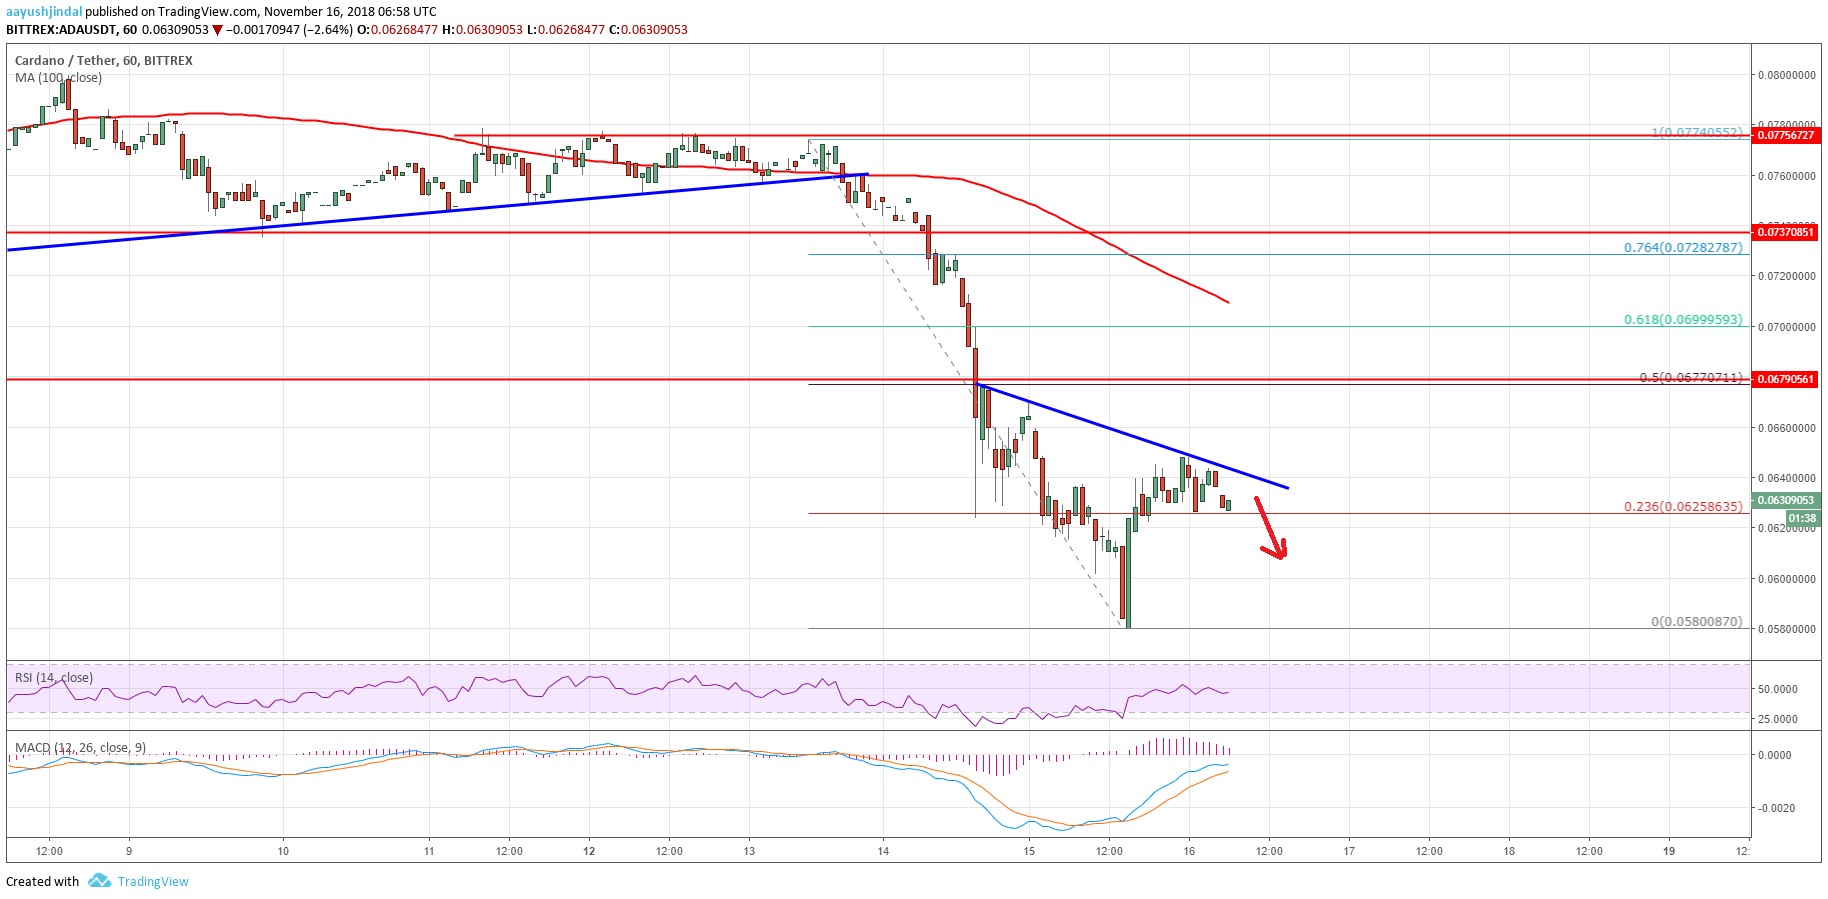
- There is a key bearish trend line formed with resistance at $0.0640 on the hourly chart of the ADA/USD pair (data feed via Bittrex).
- The pair is likely to decline once again if sellers push the price below the $0.0620 support.
Cardano price tumbled recently against the US Dollar and Bitcoin. ADA/USD is currently recovering, but upsides are capped near $0.0640 and $0.0675.
Cardano Price Analysis
In the last analysis, we discussed the chances of more losses below $0.0720 in cardano price against the US Dollar. There was a sharp decline in bitcoin and Ethereum recently, which pushed the ADA/USD pair below $0.0700. The price tumbled and broke many supports like $0.0650 and $0.0620. There was even a break below $0.0600 and the price settled below the 100 hourly simple moving average.
The price traded as low as $0.0580 and later started an upside correction. It moved above the $0.0600 level and the $0.0620 pivot level. There was also a break above the 23.6% Fibonacci retracement level of the recent decline from the $0.0774 high to $0.0580 low. However, the upside move was capped by the $0.0650 resistance. Moreover, there is a key bearish trend line formed with resistance at $0.0640 on the hourly chart of the ADA/USD pair. Above the trend line and $0.0650, the next major resistance is near $0.0675. It represents the 50% Fibonacci retracement level of the recent decline from the $0.0774 high to $0.0580 low.

The chart indicates that ADA price recovered nicely from the $0.0580 low. However, the price is currently facing a lot of hurdles near $0.0640 and $0.0650. If buyers fail to push the price above $0.0650 or $0.0675, there could be a fresh decline below $0.0620 and $0.0600.
Hourly MACD – The MACD for ADA/USD is about to move back in the bearish zone.
Hourly RSI – The RSI for ADA/USD is currently just below the 50 level.
Major Support Level – $0.0620
Major Resistance Level – $0.0650


