
Reason to trust
How Our News is Made
Strict editorial policy that focuses on accuracy, relevance, and impartiality
Ad discliamer
Morbi pretium leo et nisl aliquam mollis. Quisque arcu lorem, ultricies quis pellentesque nec, ullamcorper eu odio.
Key Highlights
- Ripple price recovered a few points, but it faced sellers near $0.5250 against the US dollar.
- There is a short term bullish trend line formed with support at $0.5050 on the hourly chart of the XRP/USD pair (data source from Kraken).
- The pair may continue to consolidate above the $0.5000 support in the next couple of sessions.
Ripple price is currently trading in a range against the US Dollar and Bitcoin. XRP/USD must break the $0.5200-0.5250 resistance to move into a bullish zone.
Ripple Price Analysis
Yesterday, we discussed that ripple price could recover towards the $0.5200 level against the US Dollar. The XRP/USD pair did move higher and cleared the $0.5100 and $0.5180 resistance levels. The upward move was positive as the price even surpassed the $0.5200 level and settled above the 100 hourly simple moving average. However, the price failed near $0.5250 and the 50% Fib retracement level of the last drop from the $0.5610 swing high to $0.4860 swing low.
The price topped at $0.5253 and later started a downside correction. It moved below $0.5150 and the 23.6% Fib retracement level of the recent wave from the $0.4872 low to $0.5253 high. The current price action is positive above the $0.5000 support area. There is a short term bullish trend line formed with support at $0.5050 on the hourly chart of the XRP/USD pair. Besides, the 50% Fib retracement level of the recent wave from the $0.4872 low to $0.5253 high is acting as a support. As long as the price is above the trend line, $0.5000 and the 100 hourly SMA, it could recover once again.
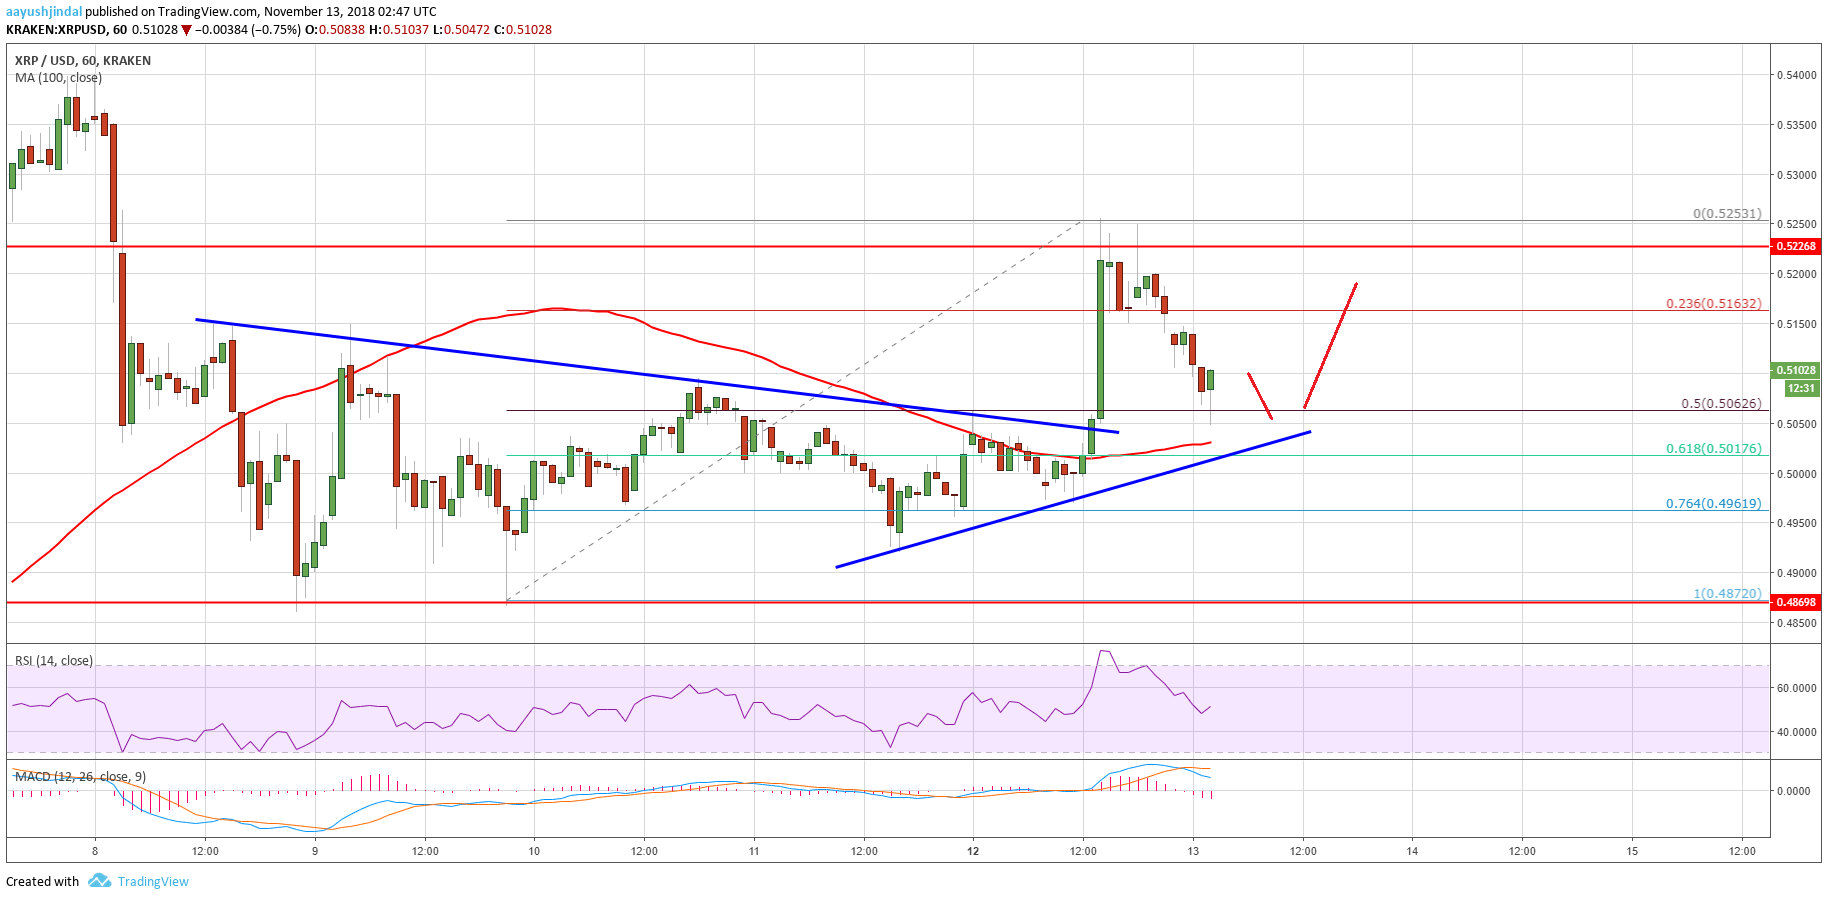
Looking at the chart, ripple price is currently consolidating above the $0.5000 support. Buyers will most likely make another attempt to push the price above $0.5200 and $0.5250 in the near term.
Looking at the technical indicators:
Hourly MACD – The MACD for XRP/USD is currently in the bearish zone.
Hourly RSI (Relative Strength Index) – The RSI for XRP/USD is hovering near the 50 level.
Major Support Level – $0.5000
Major Resistance Level – $0.5250


