
Reason to trust
How Our News is Made
Strict editorial policy that focuses on accuracy, relevance, and impartiality
Ad discliamer
Morbi pretium leo et nisl aliquam mollis. Quisque arcu lorem, ultricies quis pellentesque nec, ullamcorper eu odio.
Key Highlights
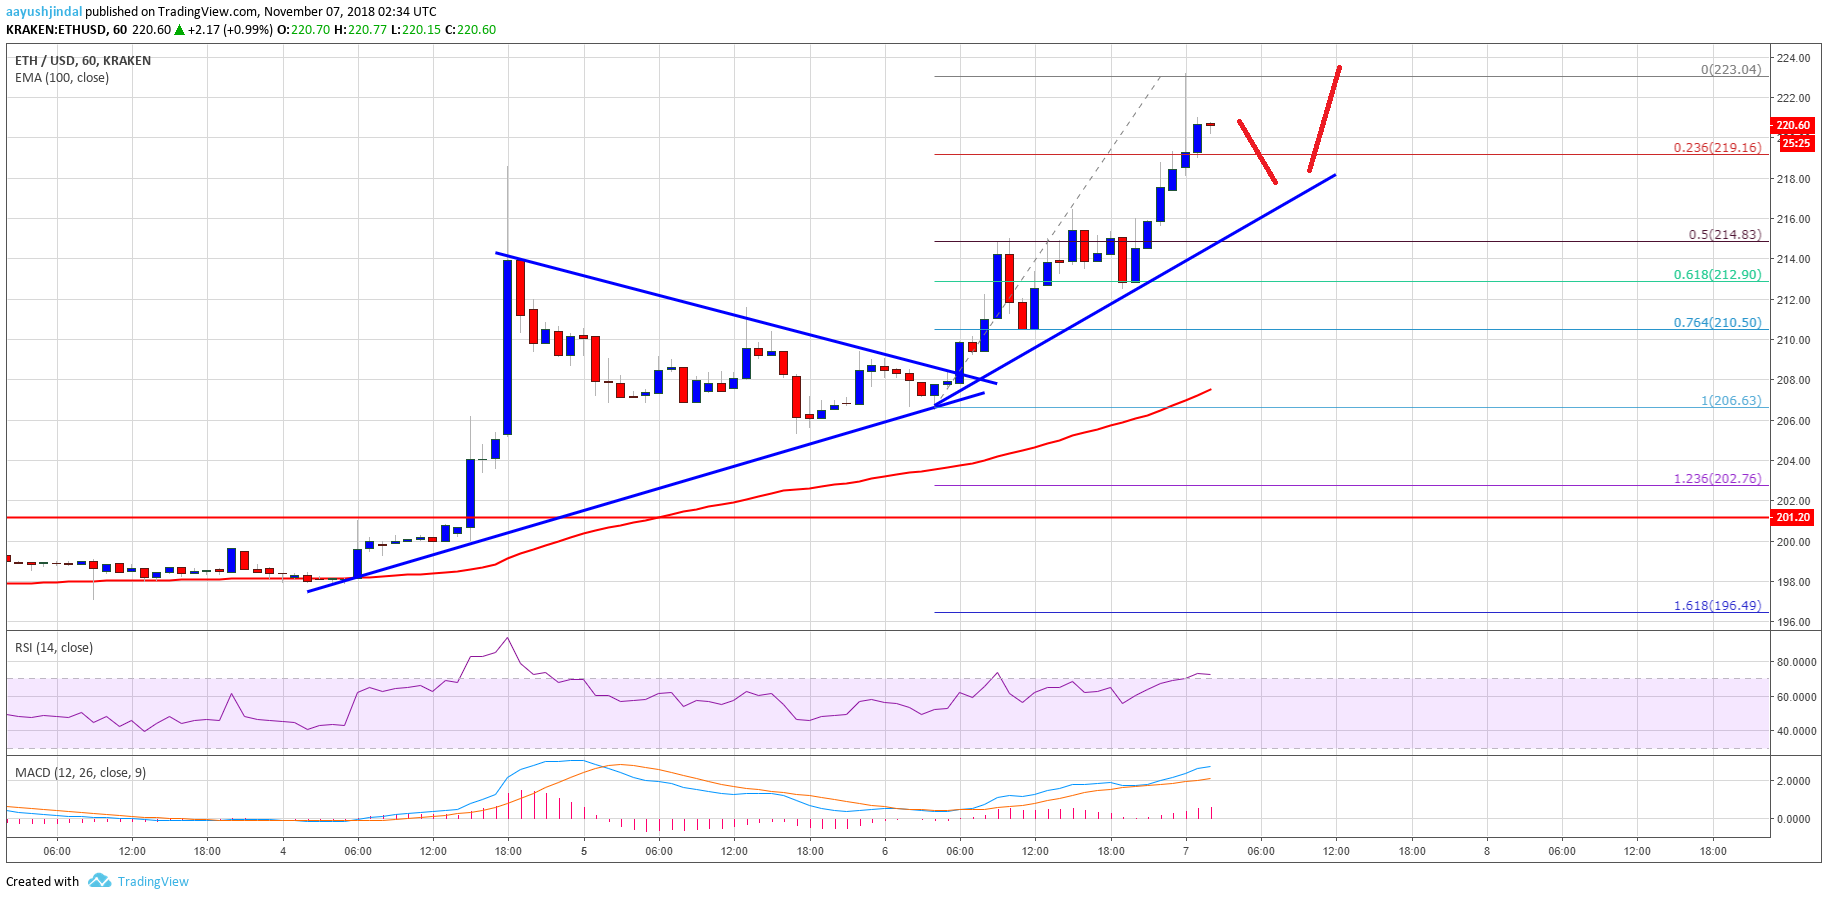
- ETH price traded higher and broke the $215 and $220 resistance levels against the US Dollar.
- Yesterday’s highlighted key breakout pattern was breached with resistance at $208 on the hourly chart of ETH/USD (data feed via Kraken).
- The pair traded towards the $223 level and it remains well supported on dips near $216.
Ethereum price is climbing higher against the US Dollar and bitcoin. ETH/USD broke the important $215 resistance to move further into a bullish zone.
Ethereum Price Analysis
Recently, there was a minor downside correction from the $216 swing high in ETH price against the US Dollar. The ETH/USD pair traded lower and tested the $205-206 support area, which prevented declines. A base was formed and the price started a fresh upward move. There was a decent bounce and the price broke the $212 and $215 resistance level. The move was such that the price traded to a new weekly high above $220 and it is currently well above the 100 hourly simple moving average.
During the upside, yesterday’s highlighted key breakout pattern was breached with resistance at $208 on the hourly chart of ETH/USD. The price traded as high as $223 and it is currently retreating a few points. An initial support is the 23.6% Fib retracement level of the recent leg from the $206 low to $223 high. There is also a connecting bullish trend line in place with support at $216 on the same chart. If there is an extended correction, the price may test $214 or the 50% Fib retracement level of the recent leg from the $206 low to $223 high.
Looking at the chart, ETH price is trading with a lot of strength and it seems like dips near $216 or $215 remains well supported. On the upside, buyers could target the $230 level in the short term.
Hourly MACD – The MACD is placed nicely in the bullish zone.
Hourly RSI – The RSI is now near the overbought levels.
Major Support Level – $215
Major Resistance Level – $230


