Key Highlights
- ADA price traded higher recently and broke the $0.0750 resistance against the US Dollar (tethered).
- There are two bullish trend lines in place with support at $0.0740 and $0.0730 on the hourly chart of the ADA/USD pair (data feed via Bittrex).
- The pair remains well supported and buyers could attempt to push the price towards $0.0800 in the near term.
Cardano price is moving nicely against the US Dollar and Bitcoin. ADA/USD is likely to continue higher towards the $0.0800 and $0.0810 levels.
Cardano Price Analysis
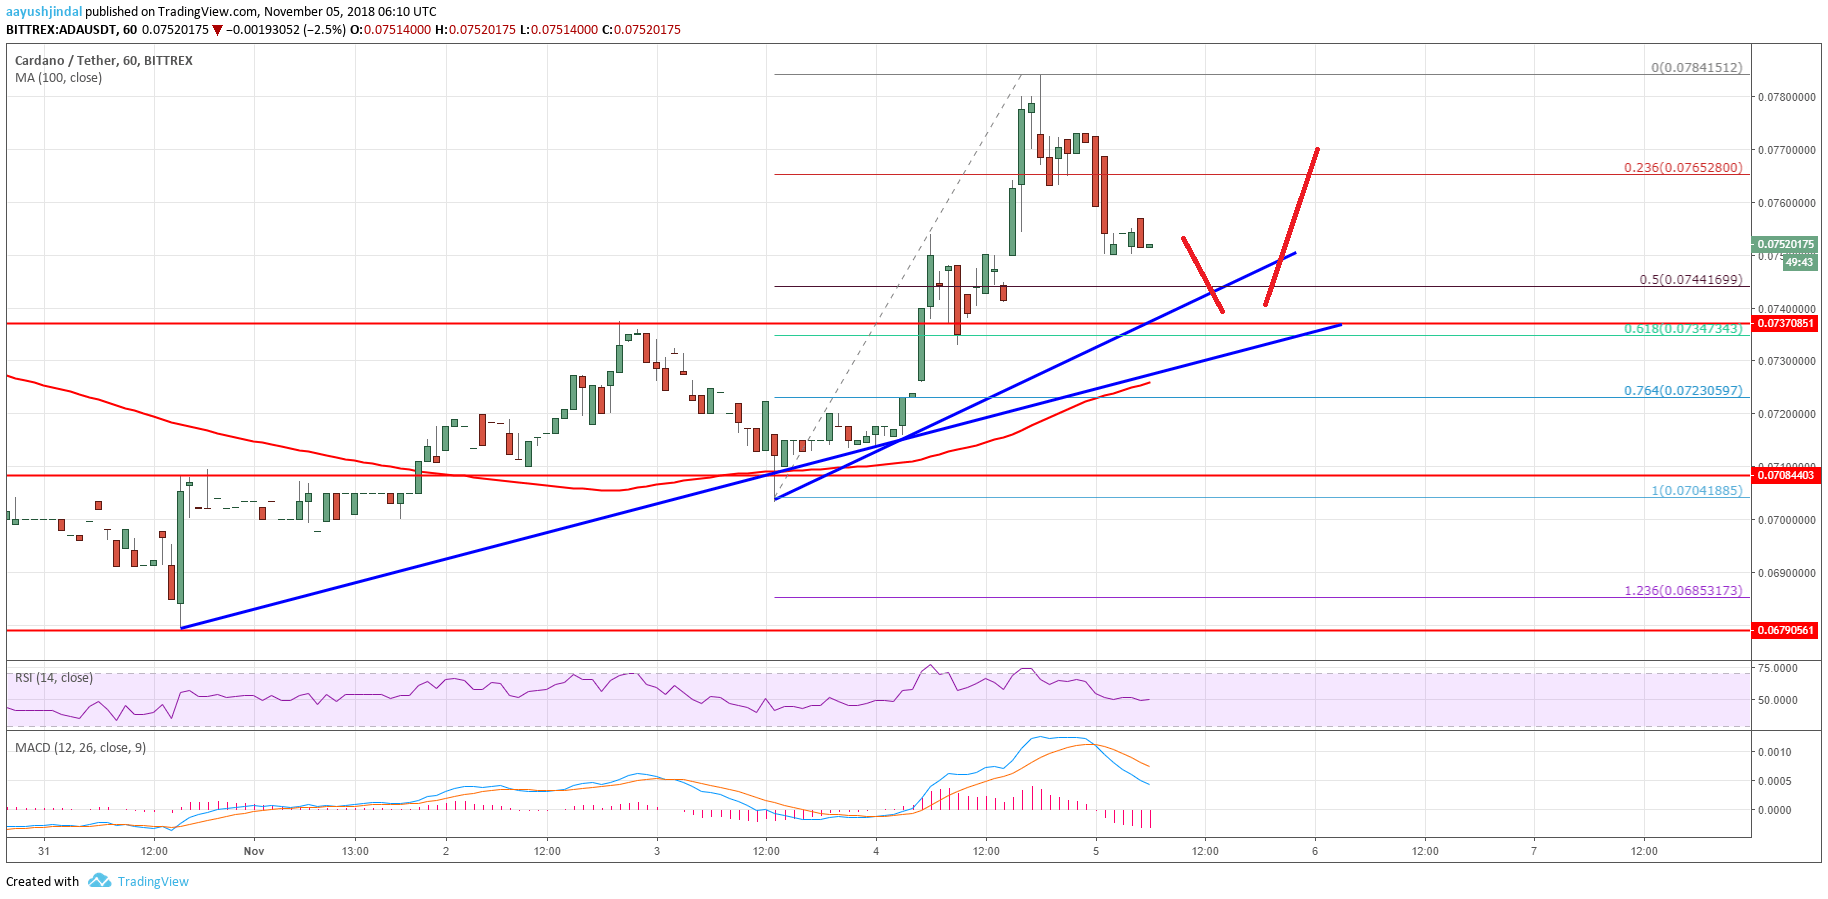
In the last analysis, we discussed the chances of a recovery above $0.0750 in cardano price against the US Dollar. The ADA/USD pair did trade higher recently and broke the $0.0750 and $0.0760 resistance levels. There was even a close above the $0.0750 level and the 100 hourly simple moving average. The upside move was strong as the price traded as high as $0.0784 before sellers appeared.
Later, the price corrected lower and declined below $0.0760. There was a break below the 23.6% Fibonacci retracement level of the recent upside move from the $0.0704 low to $0.0784 high. However, there is a strong support formed near the $0.0740 and $0.0750 levels. There are also two bullish trend lines in place with support at $0.0740 and $0.0730 on the hourly chart of the ADA/USD pair. Besides, the 50% Fibonacci retracement level of the recent upside move from the $0.0704 low to $0.0784 high at $0.0744 is an immediate support. Therefore, the price is likely to find support near the $0.0740 or $0.0730 level in the near term.

The chart indicates that ADA price is placed in a bullish zone above $0.0730. On the upside, a break above the $0.0770 and $0.0780 level could open the doors for a push towards $0.0800.
Hourly MACD – The MACD for ADA/USD moved back in the bearish zone.
Hourly RSI – The RSI for ADA/USD is currently flat near the 50 level.
Major Support Level – $0.0730
Major Resistance Level – $0.0780


