Reason to trust
How Our News is Made
Strict editorial policy that focuses on accuracy, relevance, and impartiality
Ad discliamer
Morbi pretium leo et nisl aliquam mollis. Quisque arcu lorem, ultricies quis pellentesque nec, ullamcorper eu odio.
Key Points
- Bitcoin price gained traction and moved above the $6,335 and $6,350 resistances against the US Dollar.
- There was a break above a key bearish trend line with resistance at $6,345 on the hourly chart of the BTC/USD pair (data feed from Kraken).
- The price is currently correcting lower, but there are decent supports near $6,345 and $6,325.
Bitcoin price is gaining upside momentum against the US Dollar. BTC/USD could dip a few points before it climbs above the $6,380 and $6,400 levels.
Bitcoin Price Analysis
Yesterday, we saw a decent upside move from the $6,220 swing low in bitcoin price against the US Dollar. The BTC/USD pair moved higher and traded above the $6,300 and $6,325 resistances. Later, there was a minor downside correction and the price tested the $6,290 support, which was a resistance earlier. The price bounced back again and traded above $6,335 and the 100 hourly simple moving average.
The upside move was strong as the price traded close to the $6,380 level. Moreover, there was a break above a key bearish trend line with resistance at $6,345 on the hourly chart of the BTC/USD pair. The pair traded as low as $6,379 and it is currently correcting lower. Sellers pushed the price below the 23.6% Fib retracement level of the recent wave from the $6,291 low to $6,379 high. At the moment, the broken trend line is acting as a support near $6,345-50. Below this, the price could test the 50% Fib retracement level of the recent wave from the $6,291 low to $6,379 high at $6,335.
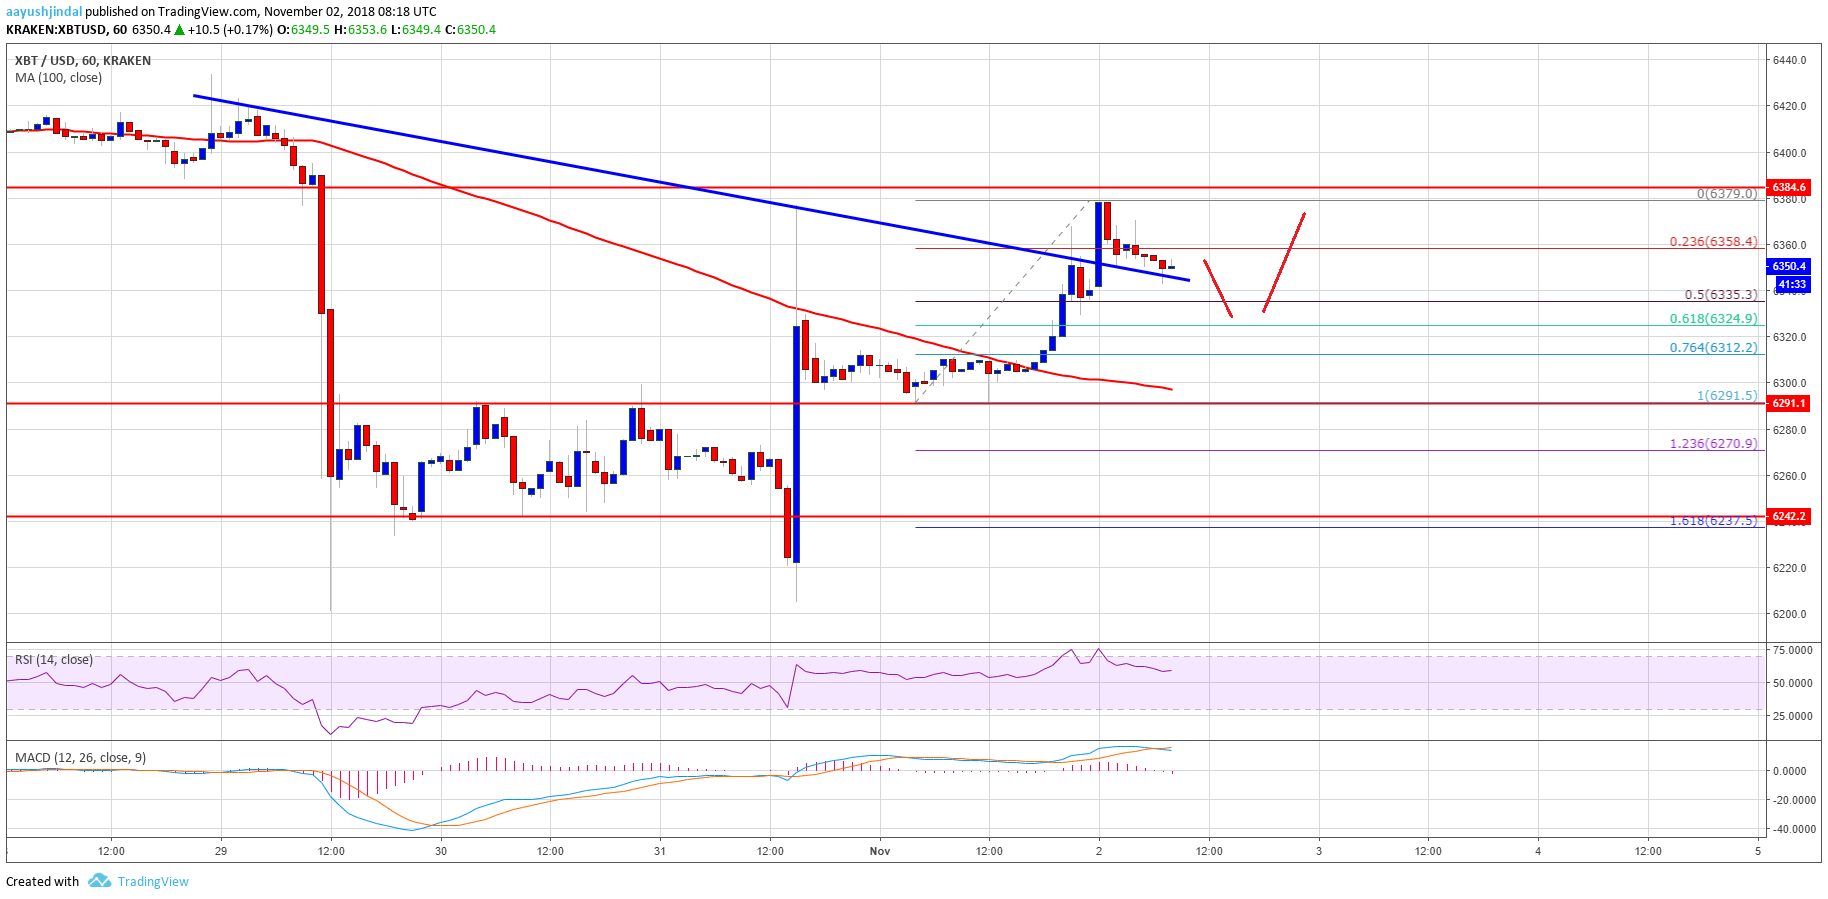
Looking at the chart, bitcoin price is pointing positive signs above the $6,325 and $6,335 levels. If there is an upside break above $6,380, the price will most likely surpass $6,400 for more gains.
Looking at the technical indicators:
Hourly MACD – The MACD for BTC/USD is slightly placed in the bearish zone.
Hourly RSI (Relative Strength Index) – The RSI is placed above the 50 level.
Major Support Level – $6,335
Major Resistance Level – $6,380