Reason to trust

How Our News is Made
Strict editorial policy that focuses on accuracy, relevance, and impartiality
Ad discliamer
Morbi pretium leo et nisl aliquam mollis. Quisque arcu lorem, ultricies quis pellentesque nec, ullamcorper eu odio.
Ripple Price Key Highlights
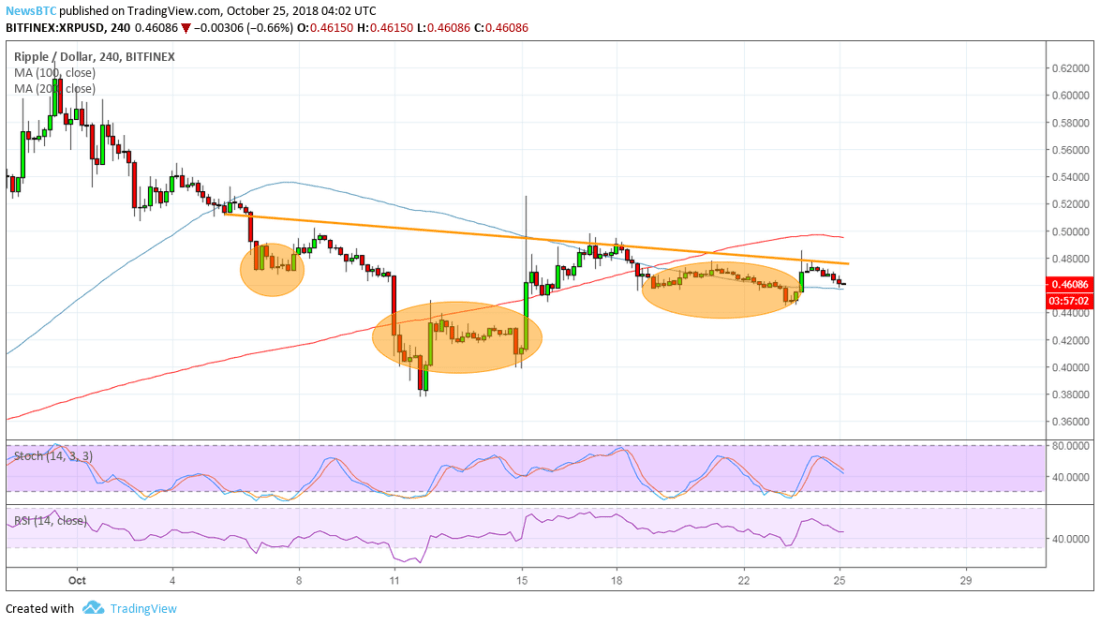
- Ripple might be done with its slide as it forms an inverted head and shoulders reversal pattern on its 4-hour chart.
- A break above the neckline could confirm that an uptrend of the same height as the chart formation might be in the works.
- However, technical indicators are still reflecting the presence of selling pressure.
Ripple might be due for a reversal from its slide as an inverted head and shoulders can be seen on the 4-hour time frame.
Technical Indicators Signals
The 100 SMA is below the longer-term 200 SMA to signal that the path of least resistance is to the downside. In other words, the downtrend is more likely to resume than to reverse. Price is trading slightly above the 100 SMA dynamic inflection point to reflect a bit of bullish pressure but might still hit a roadblock at the 200 SMA.
In that case, Ripple might still retreat to the lows around 0.3800 or lower. A break past the neckline, on the other hand, could spur a rally that around 0.1000 in height or the same size as the reversal formation.
Stochastic is pointing down, though, indicating that sellers are returning without even seeing overbought conditions. RSI is moving south as well so Ripple might follow suit while bearish momentum is in play.

Ripple does have a lot to look forward to, though, as market watchers are focusing on an earlier interview with the company’s senior vice president of product management Asheesh Birla. He suggested that banks on xCurrent might want to upgrade to xRapid at some point, noting:
“To deploy something for Standard Chartered, Santander or Bank of America, our solution needs to scale to hundreds of thousands of transactions per second – this was in the design from the outset.”


