
Reason to trust
How Our News is Made
Strict editorial policy that focuses on accuracy, relevance, and impartiality
Ad discliamer
Morbi pretium leo et nisl aliquam mollis. Quisque arcu lorem, ultricies quis pellentesque nec, ullamcorper eu odio.
Key Points
- Bitcoin cash price failed to move higher and declined below the $440 support against the US Dollar.
- Yesterday’s highlighted key bullish trend line was breached with support at $442 on the hourly chart of the BCH/USD pair (data feed from Kraken).
- The pair remains is currently trading below the $450 resistance and the 100 hourly simple moving average.
Bitcoin cash price is still struggling to clear $450 against the US Dollar. BCH/USD could slide once again towards $435 and $430 to fill buy orders.
Bitcoin Cash Price Analysis
There was another attempt to break the $450 resistance by bitcoin cash price against the US Dollar. The BCH/USD pair failed to gain momentum above $450 and started a downside move. The price declined below the $440 support and settled below the 100 hourly simple moving average. Moreover, there was a break below the 50% Fib retracement level of the last leg up from the $423 swing low to $452 high.
More importantly, yesterday’s highlighted key bullish trend line was breached with support at $442 on the hourly chart of the BCH/USD pair. The pair declined towards the $435 support where buyers emerged. Moreover, the 61.8% Fib retracement level of the last leg up from the $423 swing low to $452 high acted as a support. The price recovered slightly, but it is still trading well below the $450 level. There is a new connecting bearish trend line in place with resistance at $442 on the same chart.
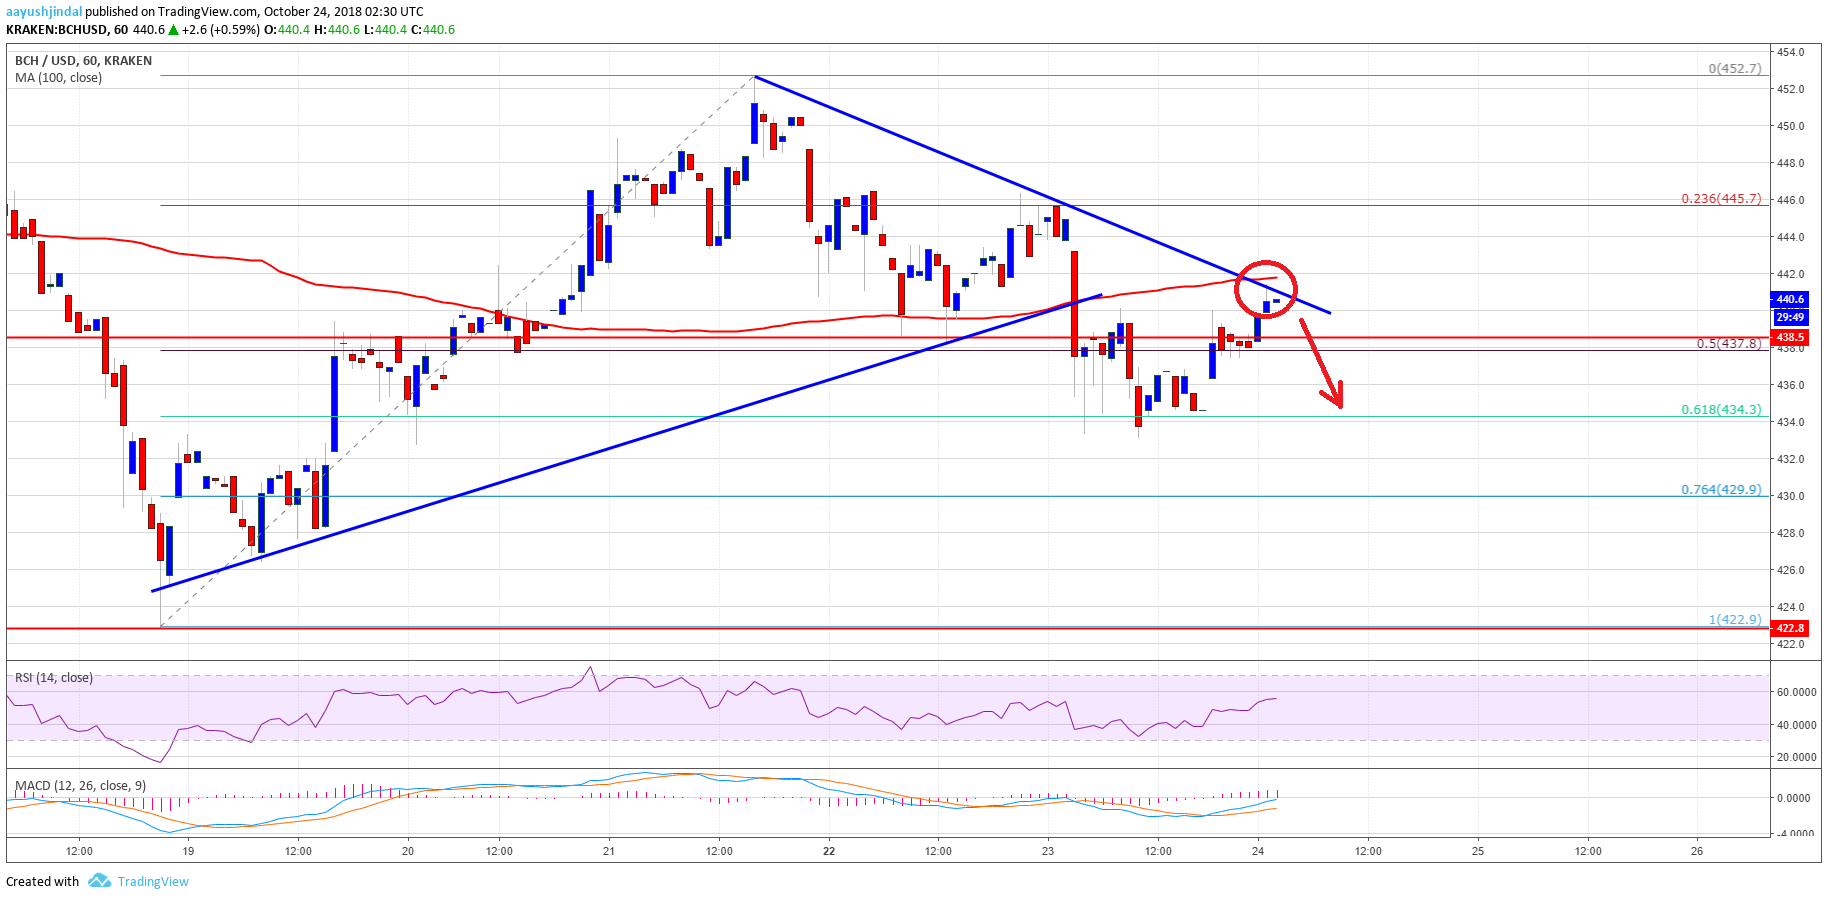
Looking at the chart, BCH price is currently under pressure below the $450 resistance and the 100 hourly simple moving average. Therefore, there could be another dip towards the $430 or $435 support before the price recovers above the $450 level.
Looking at the technical indicators:
Hourly MACD – The MACD for BCH/USD is slowly moving in the bullish zone.
Hourly RSI (Relative Strength Index) – The RSI for BCH/USD has managed to move above the 50 level.
Major Support Level – $435
Major Resistance Level – $450


