
Reason to trust
How Our News is Made
Strict editorial policy that focuses on accuracy, relevance, and impartiality
Ad discliamer
Morbi pretium leo et nisl aliquam mollis. Quisque arcu lorem, ultricies quis pellentesque nec, ullamcorper eu odio.
Key Points
- Bitcoin price declined recently and tested the $6,350 support level against the US Dollar.
- There was a break above a connecting bearish trend line with resistance at $6,410 on the 4-hours chart of the BTC/USD pair (data feed from Kraken).
- The pair is facing a solid resistance near the $6,480 and $6,500 levels.
Bitcoin price is consolidating above the $6,350 support against the US Dollar. BTC/USD must break the $6,500 resistance zone to move into a bullish zone.
Bitcoin Price Analysis
There were more than three attempts to surpass the $6,480 and $6,500 resistances by bitcoin price against the US Dollar. The BTC/USD pair failed to gain momentum above the $6,500 level and later declined. The price traded below the $6,400 support and tested the $6,350 support. During the decline, there was a break below the 61.8% Fib retracement level of the last wave from the $6,150 swing low to $6,825 high.
However, buyers managed to hold losses below the $6,350 support level. There was also no test of the 76.4% Fib retracement level of the last wave from the $6,150 swing low to $6,825 high. Later, the price started a decent recovery and moved above the $6,400 resistance. Moreover, there was a break above a connecting bearish trend line with resistance at $6,410 on the 4-hours chart of the BTC/USD pair. The pair is currently trading below the $6,450 resistance. The most important hurdle for buyers is near the $6,480 and $6,500 levels.
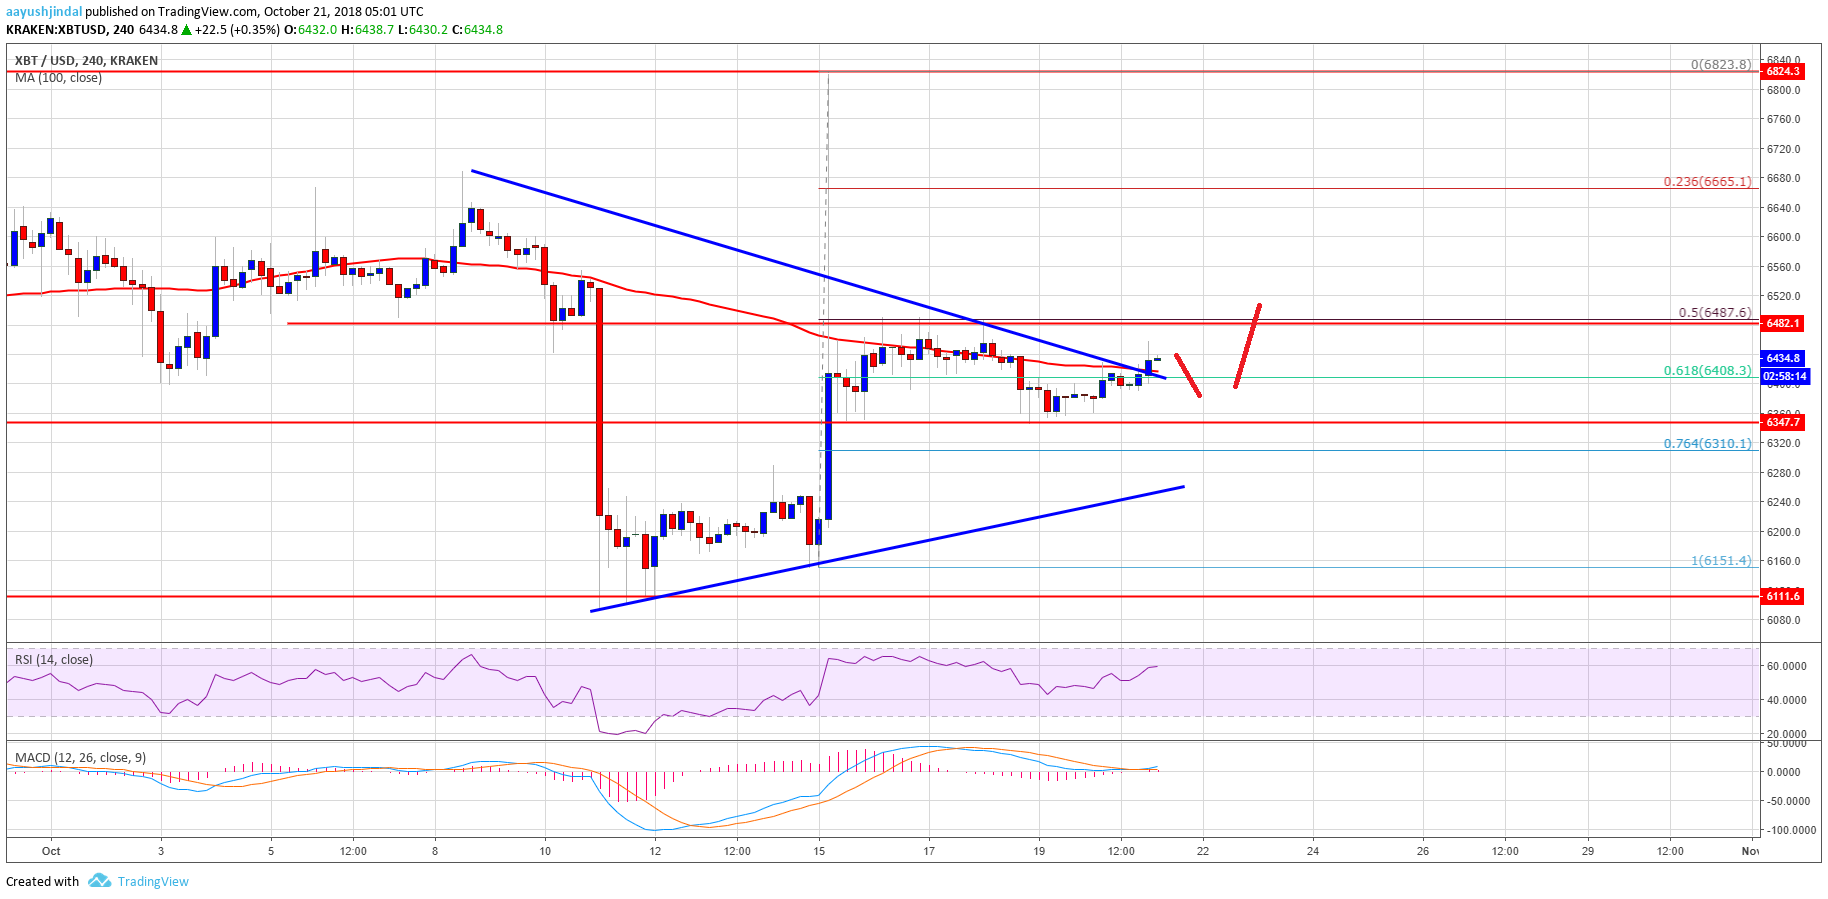
Looking at the chart, BTC price could attempt to clear the $6,500 resistance in the coming sessions. If buyers succeed, there may well be more gains above the $6,550 level and the 100 SMA. On the flip side, if the price fails again to break $6,500, it might decline to $6,350 or even $6,200.
Looking at the technical indicators:
4-hours MACD – The MACD for BTC/USD is slowly moving back in the bullish zone.
4-hours RSI (Relative Strength Index) – The RSI is currently well above the 50 level.
Major Support Level – $6,350
Major Resistance Level – $6,500


