
Reason to trust
How Our News is Made
Strict editorial policy that focuses on accuracy, relevance, and impartiality
Ad discliamer
Morbi pretium leo et nisl aliquam mollis. Quisque arcu lorem, ultricies quis pellentesque nec, ullamcorper eu odio.
Key Points
- Bitcoin price extended losses and declined below the $6,450 support level against the US Dollar.
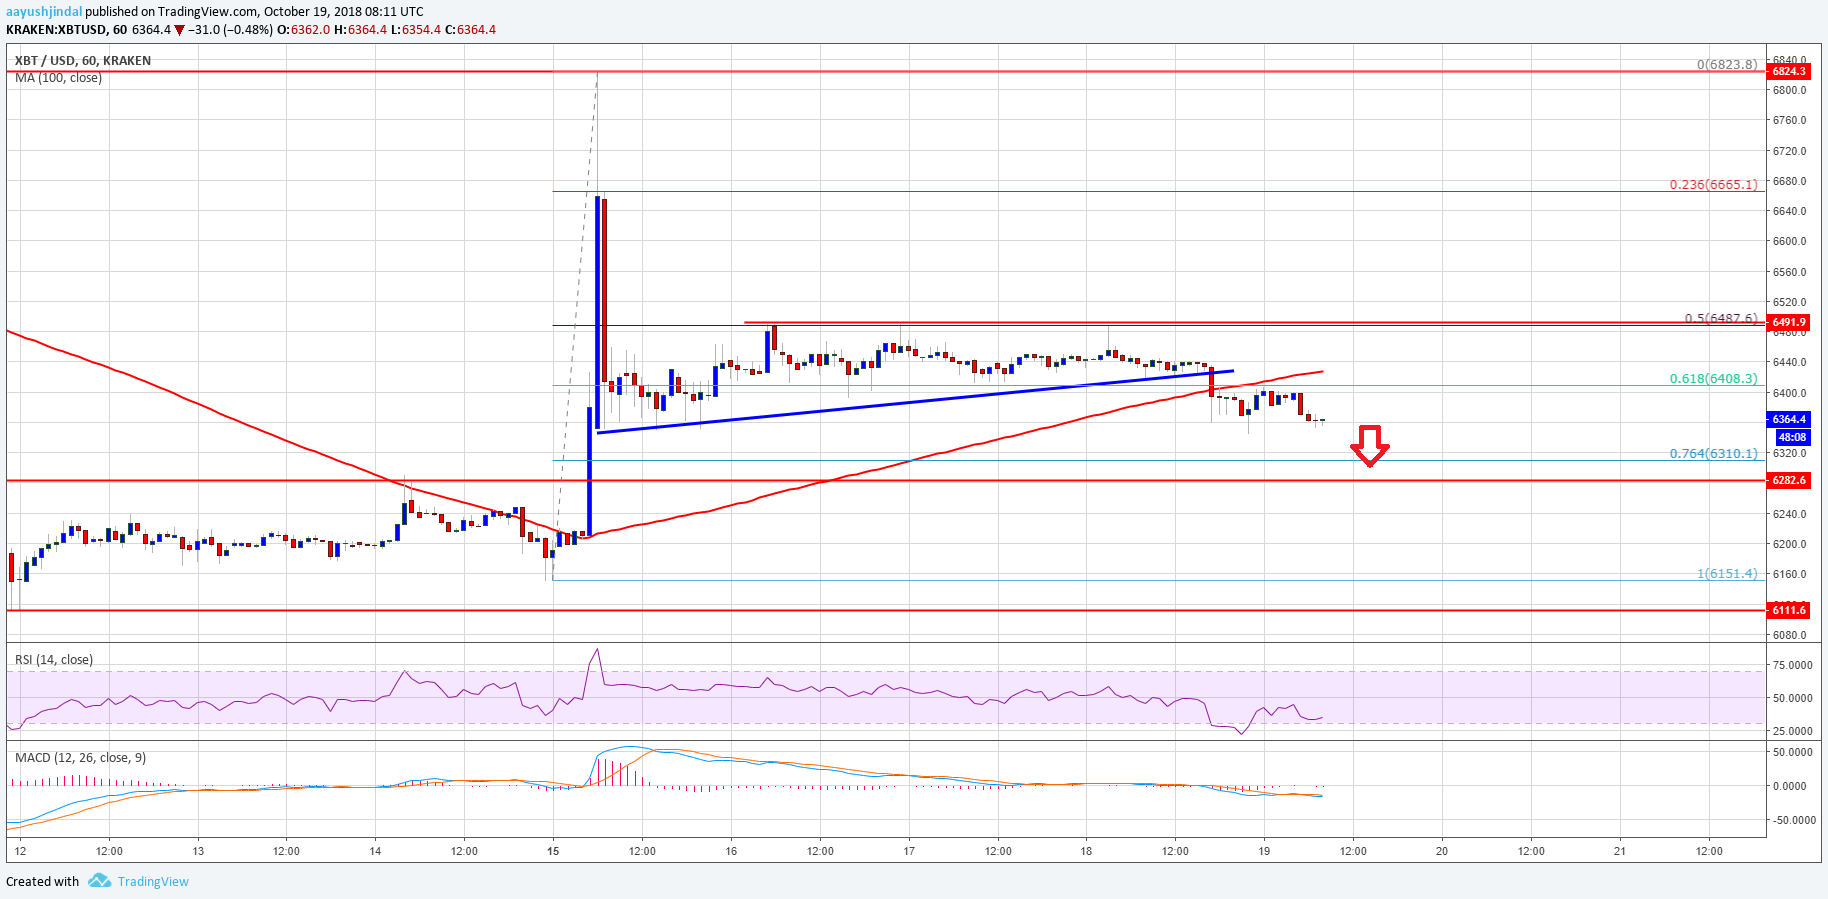
- Yesterday’s highlighted key bullish trend line was broken with support at $6,435 on the hourly chart of the BTC/USD pair (data feed from Kraken).
- The price declined below the $6,400 support and the 100 hourly simple moving average.
Bitcoin price is back to square one below $6,450 against the US Dollar. BTC/USD is now at a risk of more losses towards the $6,285 support.
Bitcoin Price Analysis
After three failed attempts to break the $6,485-6,490 resistance, bitcoin price declined against the US Dollar. The BTC/USD pair faced a lot of selling pressure as it declined below the $6,450 support. During the slide, the price broke the 61.8% Fib retracement level of the last wave from the $6,151 low to $6,823 high. Besides, there was a break below the $6,400 support and the 100 hourly simple moving average.
More importantly, yesterday’s highlighted key bullish trend line was broken with support at $6,435 on the hourly chart of the BTC/USD pair. The pair traded towards the $6,350 level and it is currently consolidating losses. The next support is around the $6,310 level. It represents the 76.4% Fib retracement level of the last wave from the $6,151 low to $6,823 high. Below this, the price will most likely drop towards the main support at $6,285 (the previous resistance). Any further losses will most likely put sellers in control for a push towards $6,110.
Looking at the chart, bitcoin price is currently in a bearish zone below $6,450 and the 100 hourly SMA. To bounce back, the price must break the $6,450 and $6,485 resistance levels. If not, there is a significant risk of further slides towards the $6,285 support in the near term.
Looking at the technical indicators:
Hourly MACD – The MACD for BTC/USD is back in the bearish zone.
Hourly RSI (Relative Strength Index) – The RSI is now well below the 40 level.
Major Support Level – $6,285
Major Resistance Level – $6,450