Reason to trust

How Our News is Made
Strict editorial policy that focuses on accuracy, relevance, and impartiality
Ad discliamer
Morbi pretium leo et nisl aliquam mollis. Quisque arcu lorem, ultricies quis pellentesque nec, ullamcorper eu odio.
Ripple Price Key Highlights
- Ripple price recently busted through the short-term descending trend line to signal a reversal.
- Price might still need to make a pullback in order to gather more bullish momentum to sustain the rally.
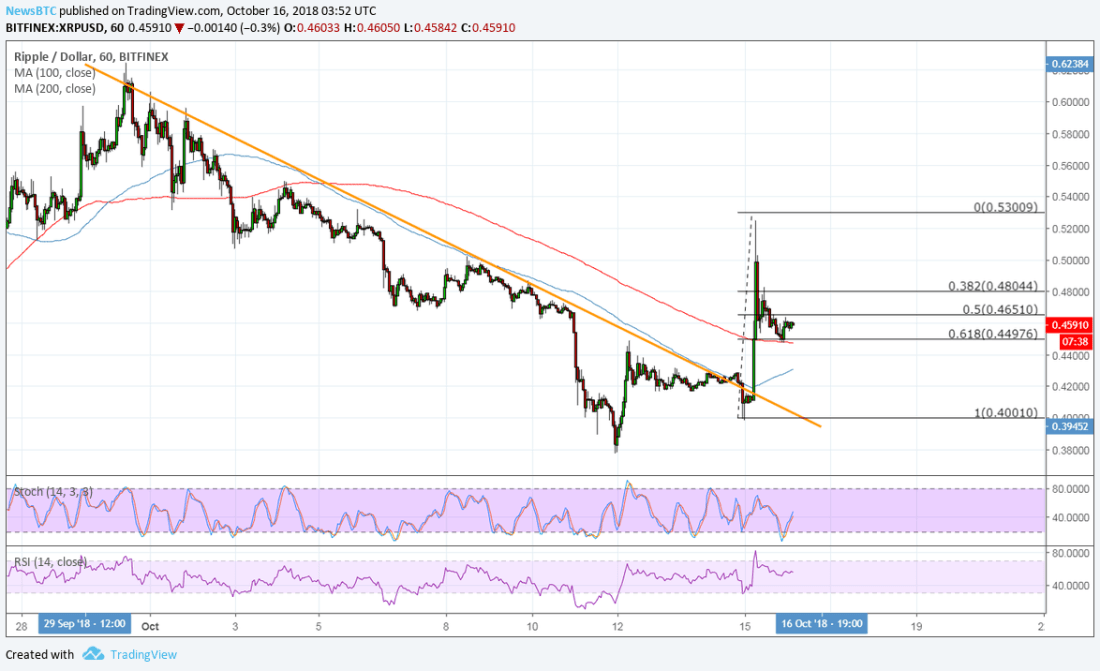
- The 61.8% Fib already seems to be holding, though, and technical indicators are reflecting a pickup in buying pressure.
Ripple price looks ready to resume its longer-term rally after breaking past a short-term descending trend line.
Technical Indicators Signals
The 100 SMA is still below the longer-term 200 SMA to signal that the path of least resistance is to the downside or that there’s a chance the selloff could resume. However, the gap between the moving averages is narrowing to reflecting slowing bearish pressure and a possible bullish crossover.
In addition, the 200 SMA dynamic inflection point coincides with the 61.8% Fibonacci retracement level that already seems to be keeping losses in check. If so, Ripple price could make its way back up to the swing high at 0.5300 or higher.
Stochastic has already pulled out of the oversold region to bring a return in buying pressure. A bullish divergence was also reflected, adding confirmation that buyers are gaining the upper hand. On the other hand, RSI is still treading lower and has plenty of room to slide, so a deeper correction is still a possibility.

Ripple has been one of the more resilient cryptocurrencies lately thanks to positive developments specific to this digital asset. Anticipation for its partners shifting to the xRapid platform continues to support speculations of stronger volume and increased activity for XRP.
It also helped that bitcoin and its peers enjoyed rallies on the Tether sharp selloff, which was then followed by an update on Fidelity’s platform for institutional investors. These could be enough to shore positive sentiment in the industry for much longer, paving the way for a more sustained recovery.


