
Reason to trust
How Our News is Made
Strict editorial policy that focuses on accuracy, relevance, and impartiality
Ad discliamer
Morbi pretium leo et nisl aliquam mollis. Quisque arcu lorem, ultricies quis pellentesque nec, ullamcorper eu odio.
Key Highlights
- ETH price finally gained momentum and broke the $197 resistance against the US Dollar.
- There was a break above a key bearish trend line with resistance at $197 on the hourly chart of ETH/USD (data feed via Kraken).
- The pair is now placed nicely above the $197 and $200 resistance levels.
Ethereum price gained momentum recently against the US Dollar and bitcoin. ETH/USD is now placed for more gains above the $197, $198 and $200 resistance levels.
Ethereum Price Analysis
Recently, there was a minor upside move from the $184 swing low in ETH price against the US Dollar. The ETH/USD pair traded above the $190 and $192 resistance levels. However, the upside move was capped by the $199-200 area. The price failed to break the $200 zone and slowly turned south. It declined below the 50% Fib retracement level of the recent wave from the $184 low to $199 high.
However, buyers appeared near the $188-190 area. Moreover, the 61.8% Fib retracement level of the recent wave from the $184 low to $199 high also acted as a support. Later, the price jumped higher and moved above the $190 and $197 resistance levels with a positive angle. More importantly, the price surpassed a strong resistance near the $200 level. There was also a break above a key bearish trend line with resistance at $197 on the hourly chart of ETH/USD. Above the trend line, the 100 hourly simple moving average was beached near the $199 level. Therefore, a break and close above the $199-200 zone is a positive zone.
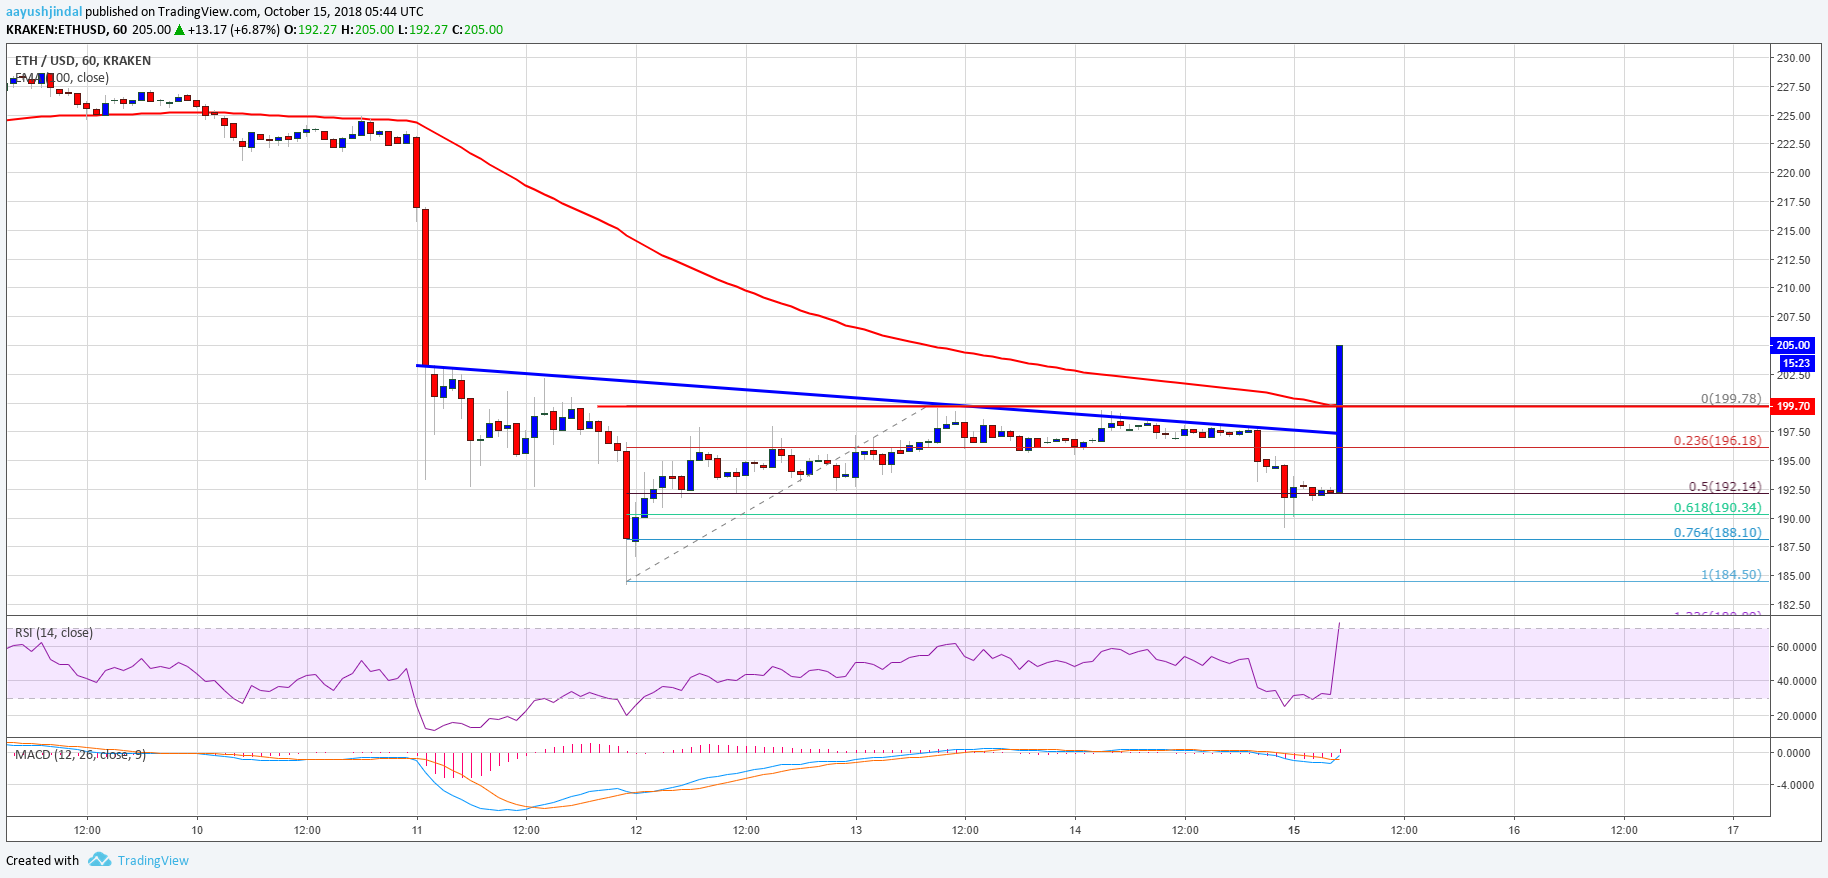
Looking at the chart, ETH price seems to be gaining pace above $197. As long as there is no false break above the $200 handle and the 100 hourly SMA, there are chances of more upsides. On the upsides, the next resistances are at $207 and $210.
Hourly MACD – The MACD is moving in the bullish zone.
Hourly RSI – The RSI currently near the 60 level with a bearish angle.
Major Support Level – $197
Major Resistance Level – $210