Reason to trust

How Our News is Made
Strict editorial policy that focuses on accuracy, relevance, and impartiality
Ad discliamer
Morbi pretium leo et nisl aliquam mollis. Quisque arcu lorem, ultricies quis pellentesque nec, ullamcorper eu odio.
Key Highlights
- ETH price declined further and traded towards the $180 level against the US Dollar.
- There was a break below a key contracting triangle with support at $194 on the hourly chart of ETH/USD (data feed via Kraken).
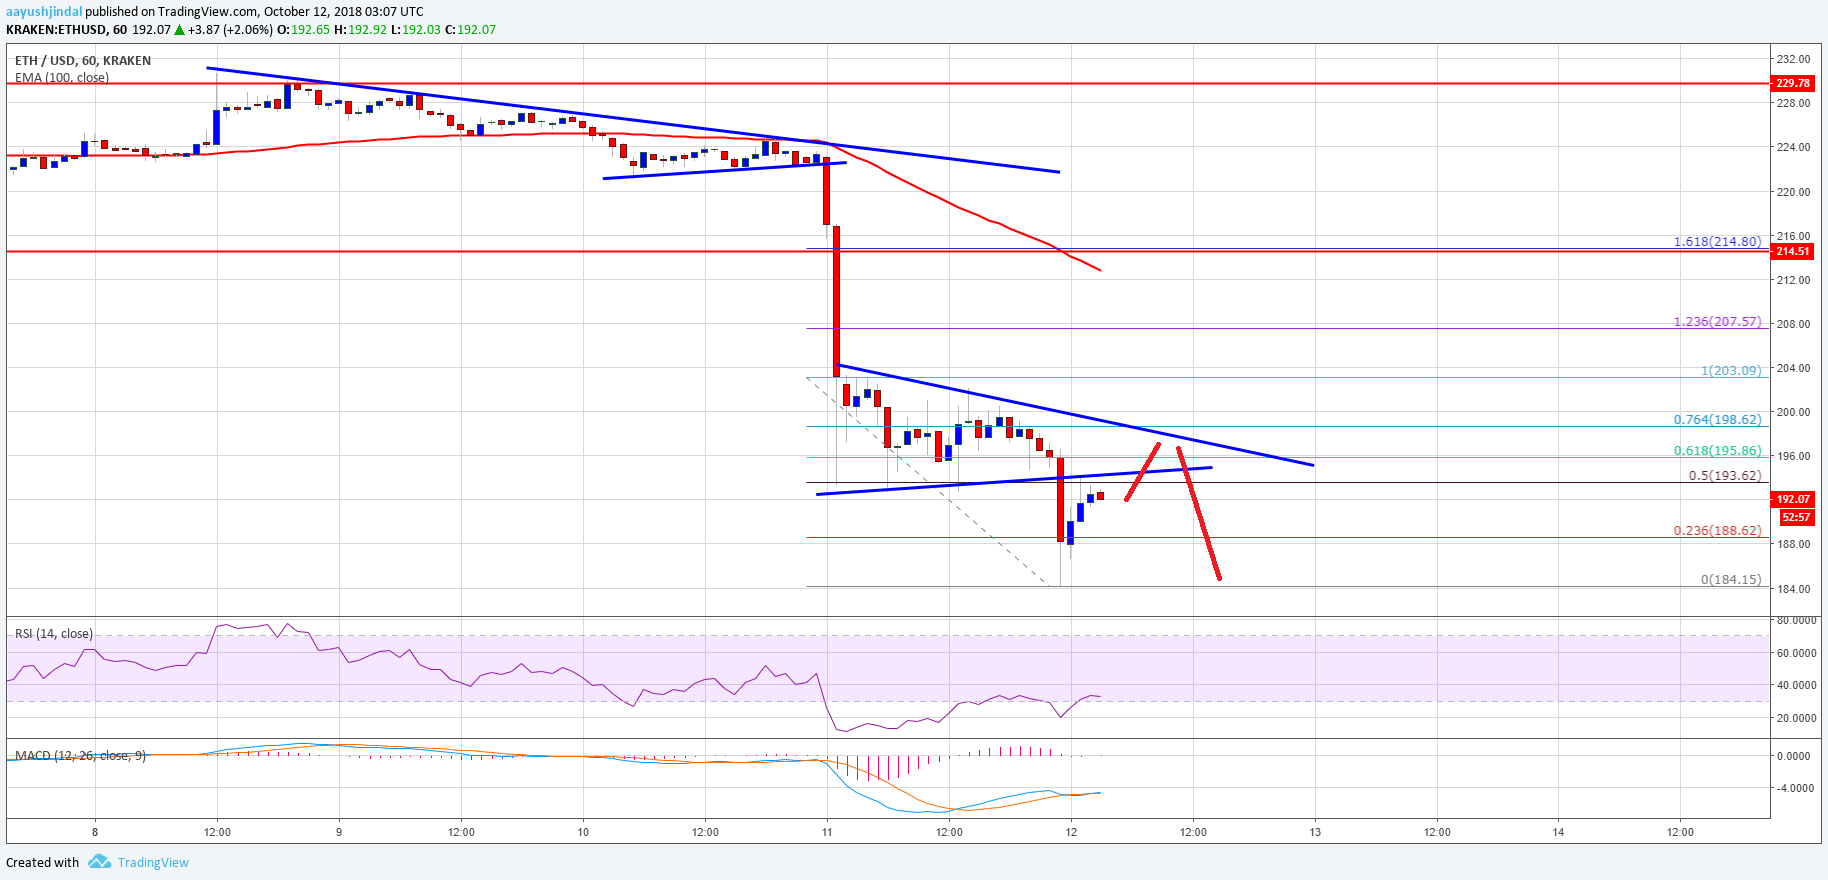
- The pair traded as low as $184.15 and it is currently correcting higher towards resistances.
Ethereum price extended losses against the US Dollar and bitcoin. ETH/USD may correct a few points, but upsides are likely to be capped near $196-198.
Ethereum Price Analysis
Yesterday, there was a sharp downside move below the $220 support in ETH price against the US Dollar. The ETH/USD pair even traded below the $200 support and later started an upside correction. However, the upside move was contained and the price was not able to move above the $205-210 zone. The price started a fresh decline and moved below yesterday’s low and the $190 level.
During the slide, there was a break below a key contracting triangle with support at $194 on the hourly chart of ETH/USD. A new monthly low was formed at $184.15 before the price started an upside correction. The price is testing the 50% Fib retracement level of the last drop from the $203 high to $184 low. On the upside, there are many resistances near the $195-198 zone. The broken triangle support and the upper trend line at $196 are likely to prevent gains. Moreover, the 61.8% Fib retracement level of the last drop from the $203 high to $184 low is also likely to act as a resistance.

Looking at the chart, ETH price seems to be approaching key resistances near the $195, $196 and $198 levels. A break above these is needed for a recovery above $200. On the downside, a push below $184 could accelerate losses towards $192.
Hourly MACD – The MACD is back in the bearish zone.
Hourly RSI – The RSI is slowly recovering, but it is still below the 40 level.
Major Support Level – $184
Major Resistance Level – $198


