
Reason to trust
How Our News is Made
Strict editorial policy that focuses on accuracy, relevance, and impartiality
Ad discliamer
Morbi pretium leo et nisl aliquam mollis. Quisque arcu lorem, ultricies quis pellentesque nec, ullamcorper eu odio.
Key Highlights
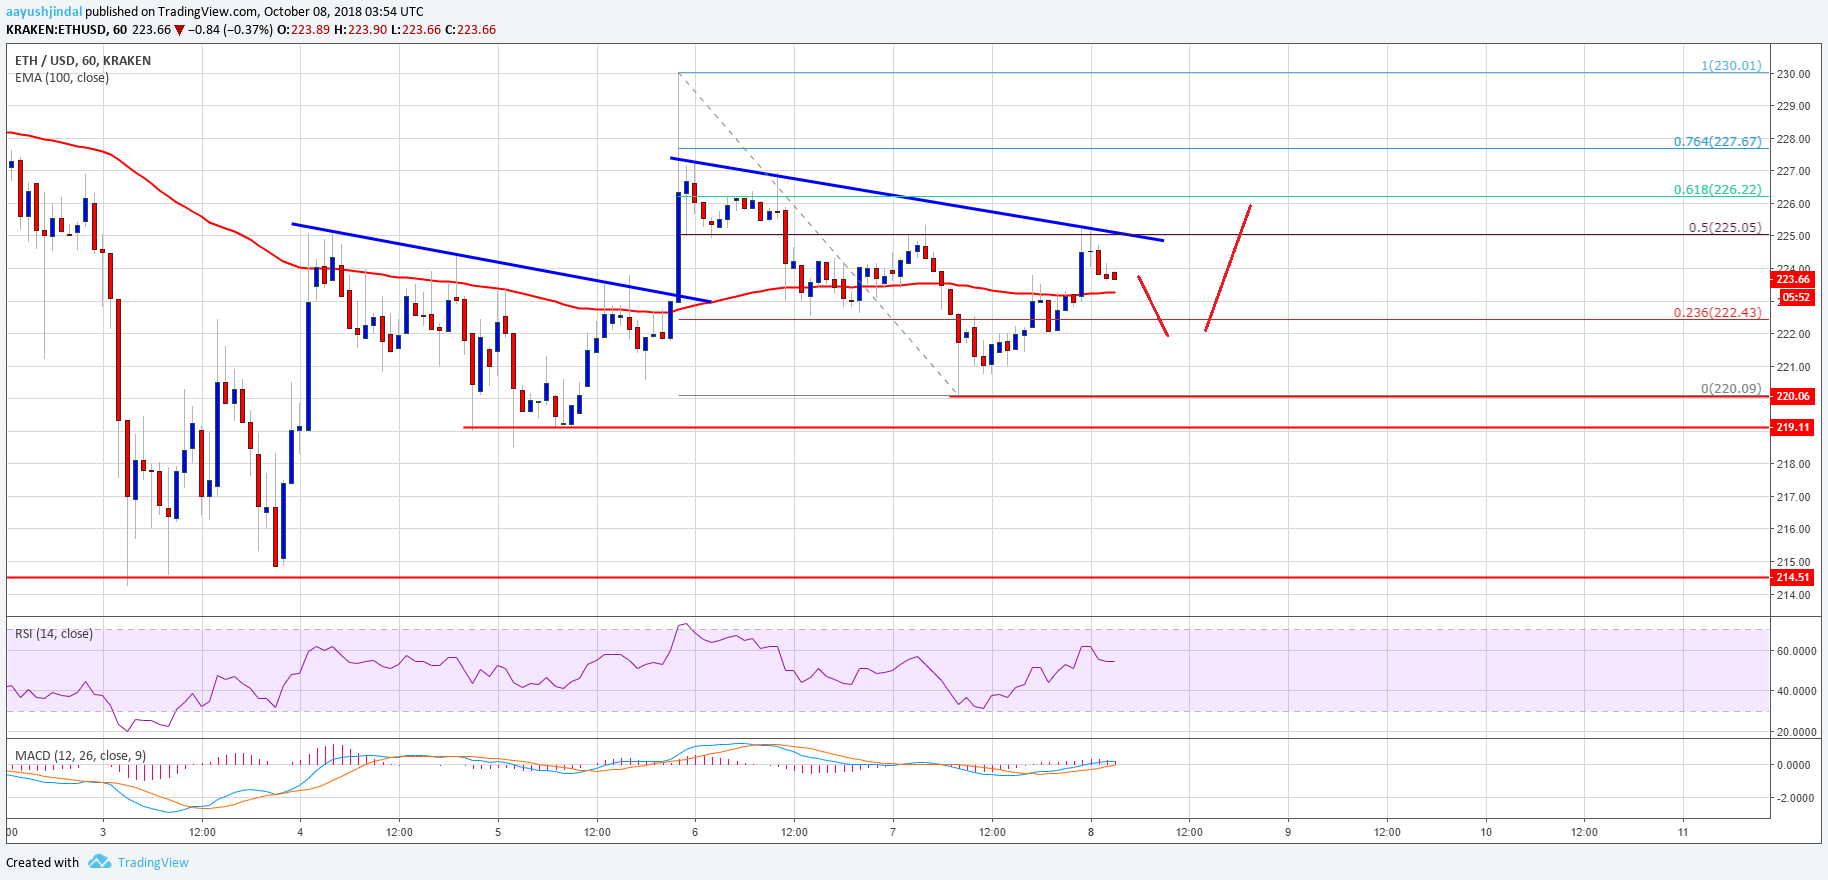
- ETH price is holding the $220 support level very well against the US Dollar.
- There is a short-term connecting bearish trend line formed with resistance at $225 on the hourly chart of ETH/USD (data feed via Kraken).
- The pair must clear the $225, $228 and $230 resistance levels to gain momentum in the near term.
Ethereum price remained above key supports against the US Dollar and bitcoin. ETH/USD is placed nicely for more gains above the $214 trend support.
Ethereum Price Analysis
Recently, there was a solid support base formed near the $219-220 zone in ETH price against the US Dollar. The ETH/USD pair started an upside move and settled above the $222 level. There was also a break above the 23.6% Fib retracement level of the recent decline from the $230 high to $220 low. Moreover, the price traded above the $224 level and settled above the 100 hourly simple moving average.
However, the upside move was capped by the $225-226 resistance zone. More importantly, there is a short-term connecting bearish trend line formed with resistance at $225 on the hourly chart of ETH/USD. Additionally, the 50% Fib retracement level of the recent decline from the $230 high to $220 low is also acting as a resistance. If buyers push the price above the trend line and $226, there could be more gains. The next major resistance on the upside above $226 is near the $230 level, which is also a significant pivot level. On the downside, an initial support is near the $222 level and the 100 hourly SMA.
Looking at the chart, ETH price is placed nicely above the $222, $220 and $214 support levels. As long as the price is above the $214 pivot level, there are chances of an upside move. In the mentioned case, the price will most likely move above the $225-226 resistance zone.
Hourly MACD – The MACD is slowly moving in the bullish zone.
Hourly RSI – The RSI is currently placed above the 50 level.
Major Support Level – $220
Major Resistance Level – $226


