
Reason to trust
How Our News is Made
Strict editorial policy that focuses on accuracy, relevance, and impartiality
Ad discliamer
Morbi pretium leo et nisl aliquam mollis. Quisque arcu lorem, ultricies quis pellentesque nec, ullamcorper eu odio.
Key Points
- Bitcoin price is trading above the $6,400 and $6,450 support levels against the US Dollar.
- There is a significant contracting triangle in place with support at $6,460 on the hourly chart of the BTC/USD pair (data feed from Kraken).
- The pair could make the next move either above $6,640 or below $6,460 in the near term.
Bitcoin price is trading nicely above the $6,350 pivot level against the US Dollar. BTC/USD is likely to make an attempt to surpass the $6,640 resistance.
Bitcoin Price Analysis
There was a strong support base formed above the $6,320 and $6,350 levels by bitcoin price against the US Dollar. The BTC/USD pair traded higher and formed a few lower highs at $6,800, $6,700 and $6,640. The recent swing low was formed at $6,398 before the price traded above $6,500. There was a break above the $6,600 level and the 100 hourly simple moving average. The price even broke the 50% Fib retracement level of the last drop from the $6,797 high to $6,398 low.
However, the upside move was capped by the $6,640 level. It represents the 61.8% Fib retracement level of the last drop from the $6,797 high to $6,398 low. The pair declined and traded below the $6,550 level and the 100 hourly SMA. At the outset, there is a significant contracting triangle in place with support at $6,460 on the hourly chart of the BTC/USD pair. On the upside, a break above the triangle resistance and $6,640 is needed for a push towards $6,800. On the other hand, below the triangle support the price could decline towards the key $6,350 support.
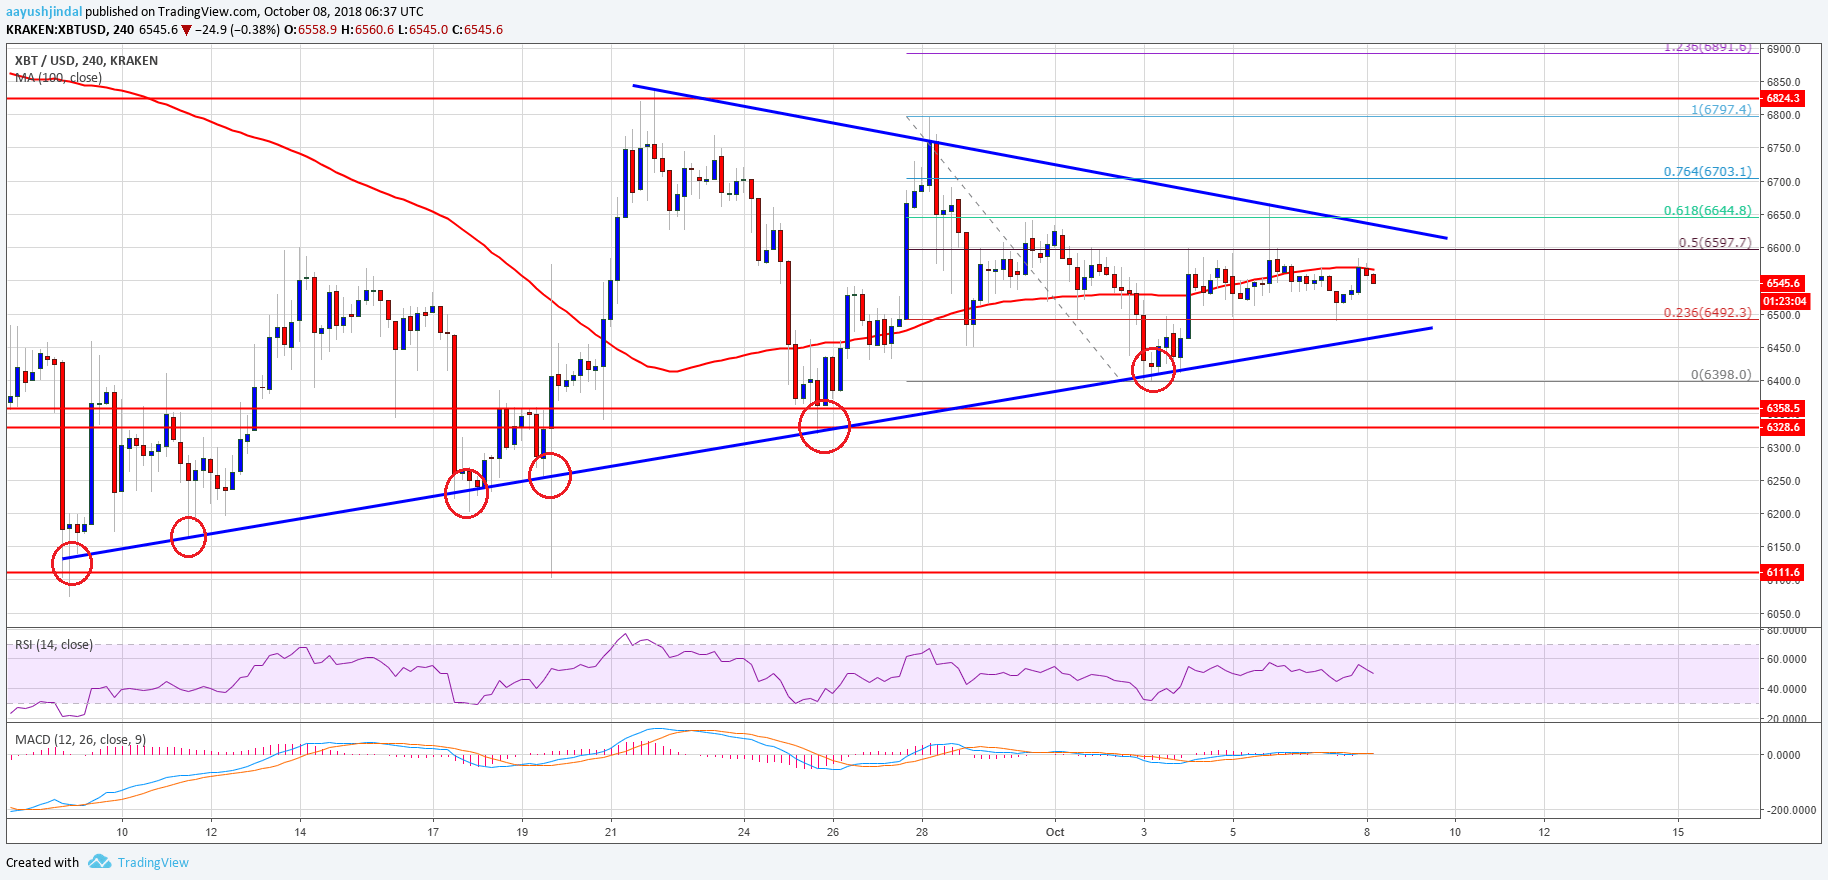
Looking at the chart, bitcoin price seems to be preparing for the next move either above $6,640 or below $6,460. The current price action indicates that buyers may soon try to push the price above $6,640 and $6,700.
Looking at the technical indicators:
Hourly MACD – The MACD for BTC/USD is mostly flat in the bearish zone.
Hourly RSI (Relative Strength Index) – The RSI is currently above the 50 level.
Major Support Level – $6,460
Major Resistance Level – $6,640


