Reason to trust
How Our News is Made
Strict editorial policy that focuses on accuracy, relevance, and impartiality
Ad discliamer
Morbi pretium leo et nisl aliquam mollis. Quisque arcu lorem, ultricies quis pellentesque nec, ullamcorper eu odio.
Key Highlights
- ETH price is facing a strong resistance near the previous support at $224-225 against the US Dollar.
- There is a declining channel in place with resistance at $223 on the hourly chart of ETH/USD (data feed via Kraken).
- The pair has to break the $223 and $224 resistance levels to gain traction in the near term.
Ethereum price is mostly consolidating against the US Dollar and bitcoin. ETH/USD could decline once again if there is no close above the $224-225 resistance.
Ethereum Price Analysis
Yesterday, there was a decent recovery above the $220 level in ETH price against the US Dollar. The ETH/USD pair also moved above the 23.6% Fib retracement level of the last drop from the $240 swing high to $214 low. However, the upside move faced a strong resistance near the previous support at $224-225. The price failed to settle above the $224 resistance and is currently moving south.
It is now trading below the 23.6% Fib retracement level of the recent upside move from the $214 low to $225 high. More importantly, it seems like the 100 hourly simple moving average is acting as a solid barrier near $223.50. There is also a declining channel in place with resistance at $223 on the hourly chart of ETH/USD. Therefore, the price has to break the $223 and $224 resistance levels to trade further higher. The next key resistance to the topside is near $234, which is the previous swing high. On the downside, the 61.8% Fib retracement level of the recent upside move from the $214 low to $225 high at $218 is an immediate support.
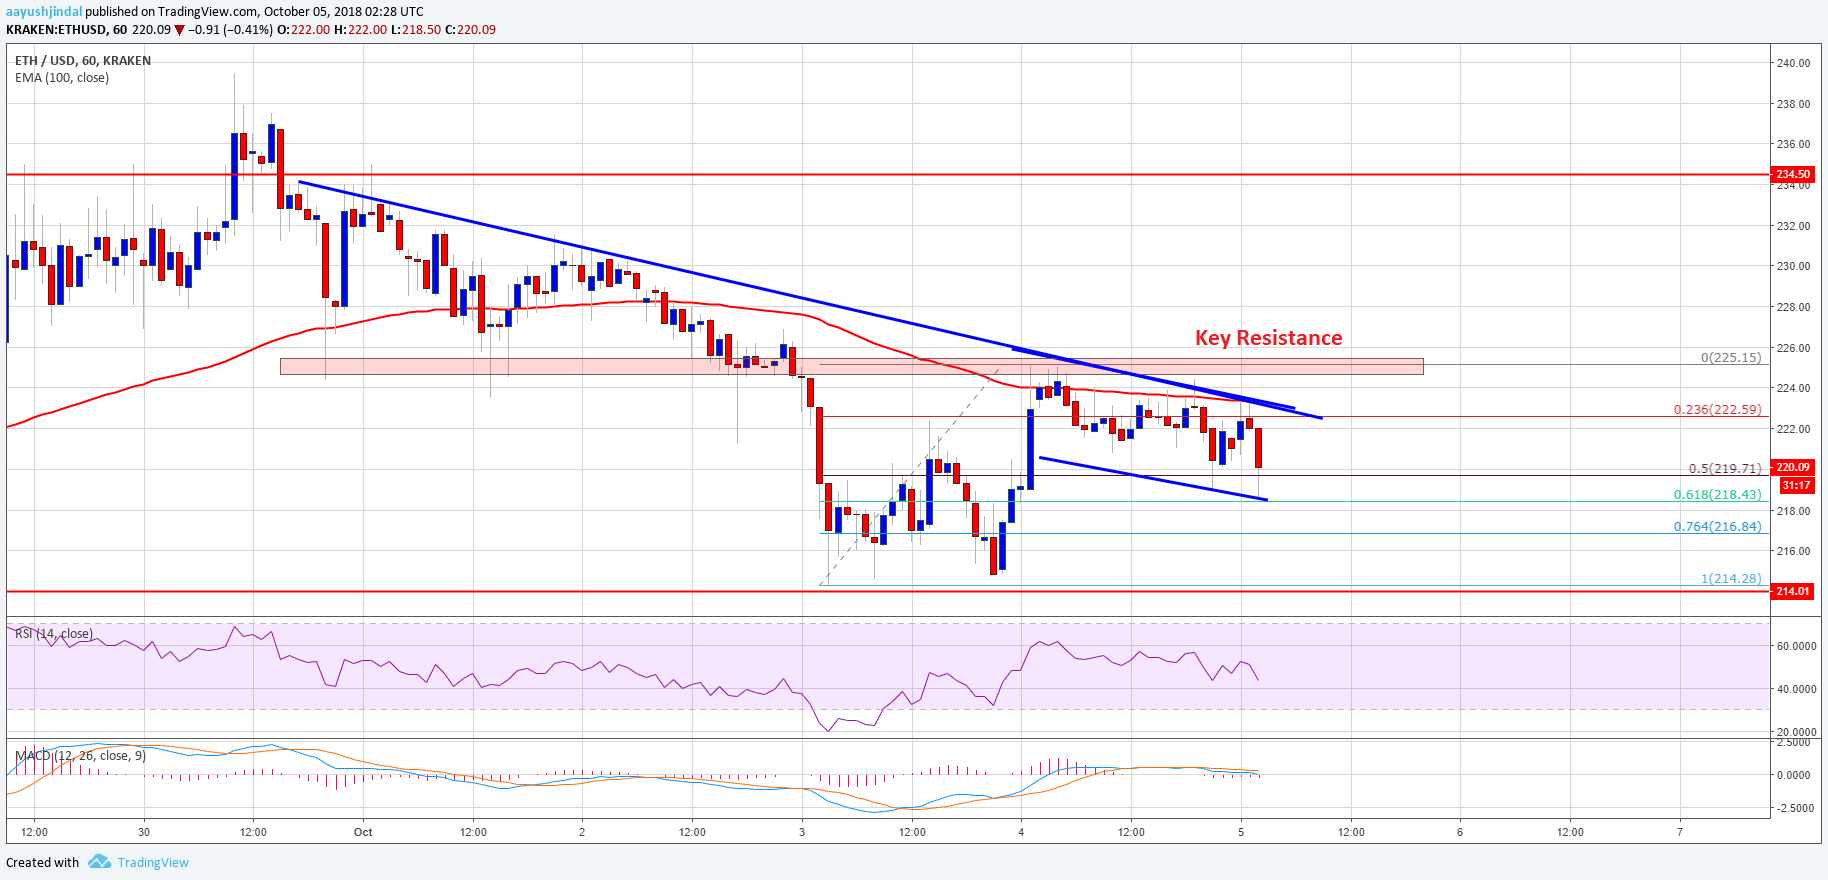
Looking at the chart, ETH price is clearly struggling to surpass the $224 resistance. If sellers push the price below the $218 support, there could be a downside break towards the $214 and $212 levels.
Hourly MACD – The MACD is slightly placed in the bearish zone.
Hourly RSI – The RSI is currently below the 50 level.
Major Support Level – $218
Major Resistance Level – $224