
Reason to trust
How Our News is Made
Strict editorial policy that focuses on accuracy, relevance, and impartiality
Ad discliamer
Morbi pretium leo et nisl aliquam mollis. Quisque arcu lorem, ultricies quis pellentesque nec, ullamcorper eu odio.
Key Points
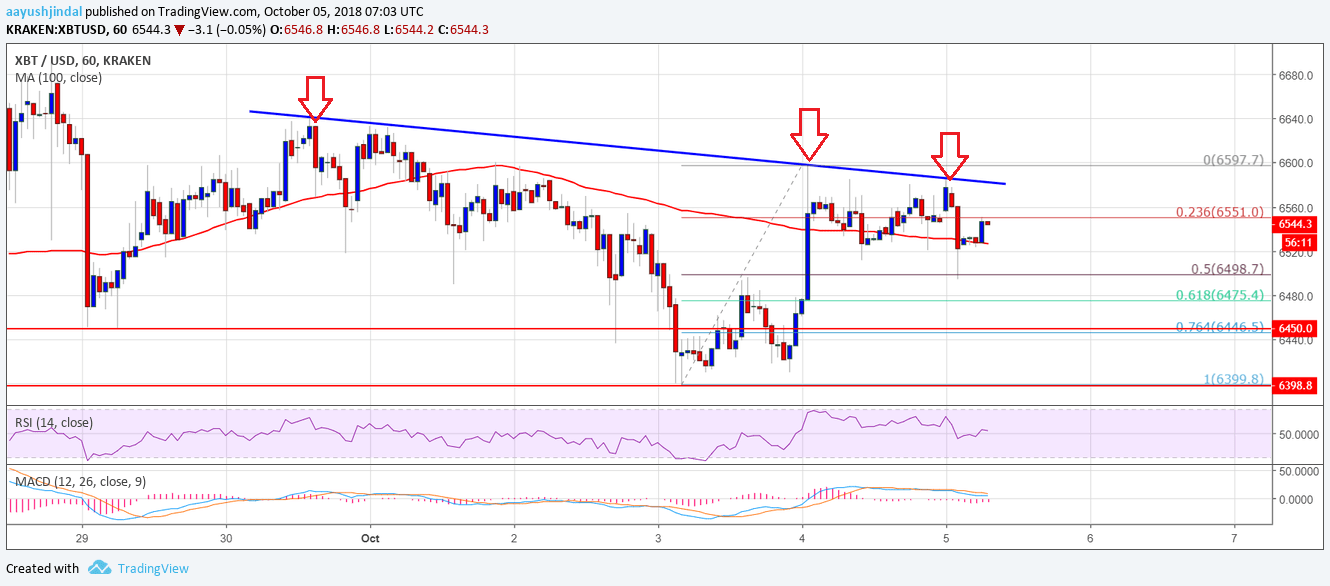
- Bitcoin price remained below the $6,600 resistance level against the US Dollar.
- This week’s followed important bearish trend line is still active with resistance at $6,585 on the hourly chart of the BTC/USD pair (data feed from Kraken).
- The pair has to clear the $6,585 and $6,600 resistance level to gain traction in the near term.
Bitcoin price struggled to clear the $6,600 resistance against the US Dollar. BTC/USD could react to the downside if there is a continuous failure near $6,600.
Bitcoin Price Analysis
During the past two analysis, we discussed the importance of the $6,600 resistance for bitcoin price against the US Dollar. The BTC/USD pair failed on many occasions to clear the $6,580 and $6,600 resistance zone. Moreover, there was also no close above the 100 hourly simple moving average and the $6,585 level. These are negative signs pointing towards a short-term weakness below the $6,550 level.
More importantly, this week’s followed important bearish trend line is still active with resistance at $6,585 on the hourly chart of the BTC/USD pair. The price recently declined below the 23.6% Fib retracement level of the last wave from the $6,399 low to $6,597 high. However, downsides were limited by the $6,500 support area. Additionally, the 50% Fib retracement level of the last wave from the $6,399 low to $6,597 high is also acting as a support. Below the $6,500 support level, there could be a bearish wave towards the $6,400 pivot level.
Looking at the chart, bitcoin price is clearly facing a solid barrier near the $6,600 level. A proper close above $6,585 and $6,600 is needed for buyers to gain upside momentum. The next crucial hurdle for them is near the $6,680 and $6,720 levels.
Looking at the technical indicators:
Hourly MACD – The MACD for BTC/USD is slowly moving in the bearish zone.
Hourly RSI (Relative Strength Index) – The RSI is just above the neutral 50 level.
Major Support Level – $6,500
Major Resistance Level – $6,600