
Reason to trust
How Our News is Made
Strict editorial policy that focuses on accuracy, relevance, and impartiality
Ad discliamer
Morbi pretium leo et nisl aliquam mollis. Quisque arcu lorem, ultricies quis pellentesque nec, ullamcorper eu odio.
Key Points
- Bitcoin cash price failed to move above the $530 resistance zone and declined against the US Dollar.
- This week’s followed important bearish trend line is intact with resistance at $525 on the hourly chart of the BCH/USD pair (data feed from Kraken).
- The pair has to move above the $525 and $530 resistance levels to gain traction in the near term.
Bitcoin cash price is showing a few bearish signs below $530 against the US Dollar. BCH/USD could decline further if buyers fail to keep the price above $500.
Bitcoin Cash Price Analysis
Yesterday, we discussed two important resistance levels near $530 and $535 for bitcoin cash price against the US Dollar. The BCH/USD pair failed to break the $530 resistance and remained under pressure. There was also no break above the 50% Fib retracement level of the last slide from the $550 high to $503 low. The price also struggled to gain traction above the 100 hourly simple moving average, which is currently at $526.
The recent swing low was formed at $507 and the price is currently correcting higher. An immediate resistance is near the 61.8% Fib retracement level of the recent drop from the $5528 high to $507 low at $520. Above this, the price is likely to face a strong resistance near the $530 zone. More importantly, this followed important bearish trend line is intact with resistance at $525 on the hourly chart of the BCH/USD pair. Therefore, buyers need to clear the $525 and $530 resistance levels to push the price in a positive zone.
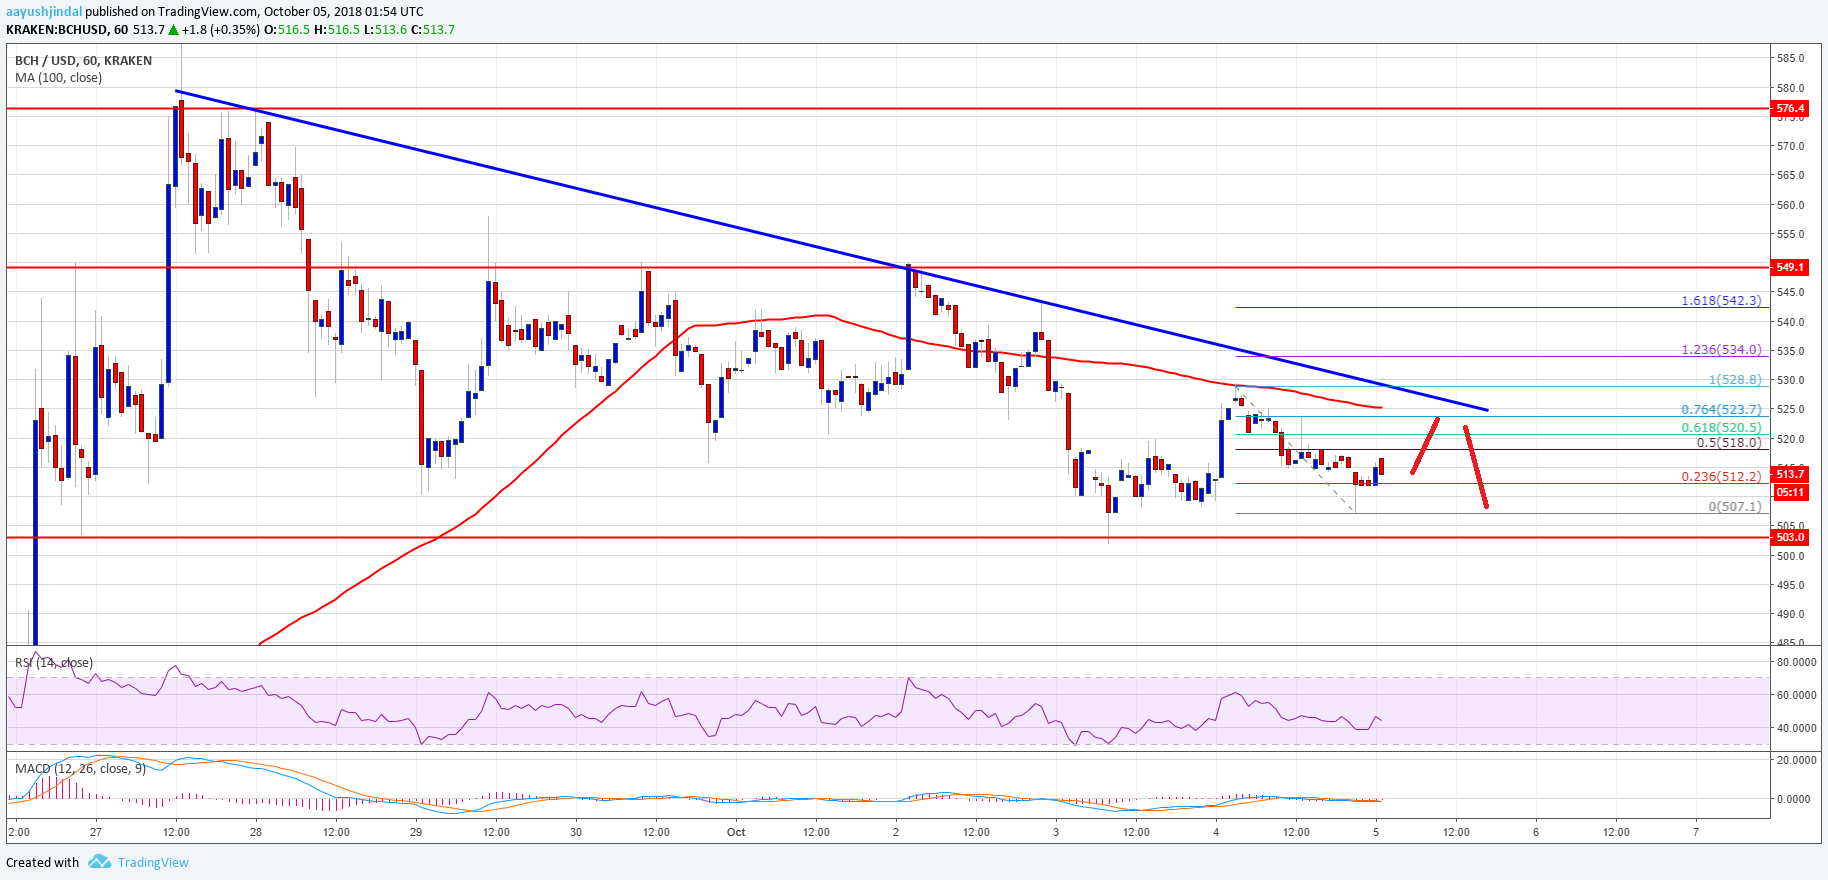
Looking at the chart, BCH price seems to be at a risk of more losses below $500. If sellers push the price below the $503 and $500 support levels, there could be more downsides.
Looking at the technical indicators:
Hourly MACD – The MACD for BCH/USD is mostly flat in the bearish zone.
Hourly RSI (Relative Strength Index) – The RSI for BCH/USD is just below the 50 level.
Major Support Level – $500
Major Resistance Level – $530


