Reason to trust
How Our News is Made
Strict editorial policy that focuses on accuracy, relevance, and impartiality
Ad discliamer
Morbi pretium leo et nisl aliquam mollis. Quisque arcu lorem, ultricies quis pellentesque nec, ullamcorper eu odio.
Key Points
- Bitcoin price is trading in a tight range above the $6,540 support against the US Dollar.
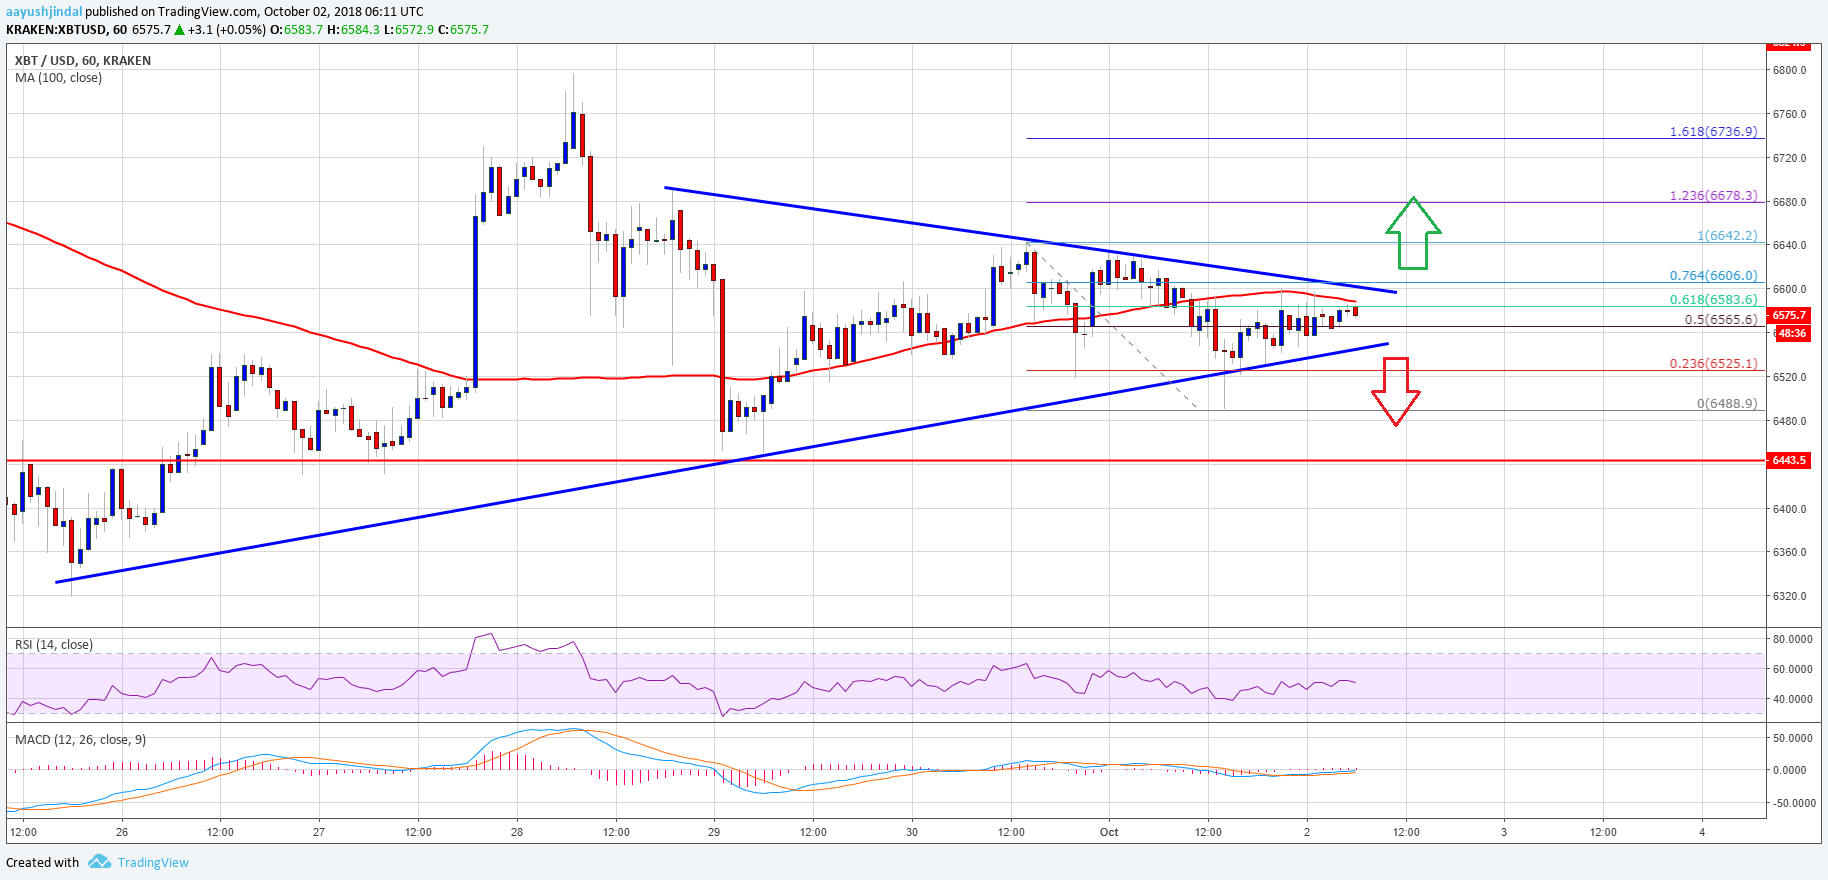
- There is a key contracting triangle in place with support at $6,545 on the hourly chart of the BTC/USD pair (data feed from Kraken).
- The pair is poised to make the next move either above $6,610 or below $6,540 in the short term.
Bitcoin price is approaching the next key break against the US Dollar. BTC/USD could climb higher if buyers push the price above $6,610 and $6,642.
Bitcoin Price Analysis
During the past two sessions, there was no major move above $6,660 in bitcoin price against the US Dollar. The BTC/USD pair remained confined in a tight range and stayed above the $6,540 support. Recently, there was a dip below the $6,500 level, but the price recovered quickly. It climbed above the $6,500 level and the 50% Fib retracement level of the recent slide from the $6,642 high to $6,488 low.
However, the upside move was capped by the $6,600 resistance and the 100 hourly simple moving average. Moreover, the 61.8% Fib retracement level of the recent slide from the $6,642 high to $6,488 low also acted as a resistance. At the outset, there is a key contracting triangle in place with support at $6,545 on the hourly chart of the BTC/USD pair. The triangle resistance is at $6,600, above which the price is likely to face sellers near the $6,642 swing high. Once there is a clear break above the $6,642 high, the price will most likely climb towards the $6,700 and $6,740 levels. On the other hand, a downside break below $6,545 and $6,520 may well open the doors for an extended slide towards $6,360.
Looking at the chart, bitcoin price seems to be preparing for the next move either above $6,610 or below $6,540. The current price action is slightly bearish, but as long as the price is above $6,500, it could trade higher.
Looking at the technical indicators:
Hourly MACD – The MACD for BTC/USD is mostly flat in the bullish zone.
Hourly RSI (Relative Strength Index) – The RSI is near the 50 level.
Major Support Level – $6,540
Major Resistance Level – $6,610