
Reason to trust
How Our News is Made
Strict editorial policy that focuses on accuracy, relevance, and impartiality
Ad discliamer
Morbi pretium leo et nisl aliquam mollis. Quisque arcu lorem, ultricies quis pellentesque nec, ullamcorper eu odio.
Key Points
- Bitcoin price recovered recently, but it failed to break the $6,540-50 resistance zone against the US Dollar.
- There is a crucial hurdle formed near $6,540 and two bearish trend lines on the hourly chart of the BTC/USD pair (data feed from Kraken).
- The pair needs to break the $6,540 resistance and the 100 hourly SMA to gain momentum.
Bitcoin price is trading below key resistances against the US Dollar. BTC/USD could retest the $6,400 and $6,350 supports before an upside move.
Bitcoin Price Analysis
There was a solid rise above the $6,400 level in bitcoin price against the US Dollar. The BTC/USD pair recovered above the $6,490 and $6,500 resistance levels. There was also a break above the 50% Fib retracement level of the downside move from the $6,660 swing high to $6,315 swing low. However, the upside move faced a strong resistance near the $6,540-50 region.
More importantly, the 61.8% Fib retracement level of the downside move from the $6,660 swing high to $6,315 swing low prevented gains. It seems like there is an important resistance formed near $6,540 and two bearish trend lines on the hourly chart of the BTC/USD pair. Additionally, the 100 hourly simple moving average is also positioned near $6,540 to act as a barrier for buyers. If bitcoin buyers succeed in surpassing the $6,540, $6,550 and the 100 hourly SMA, there could be more gains. The next resistance is at $6,660, followed by the $6,750 level.
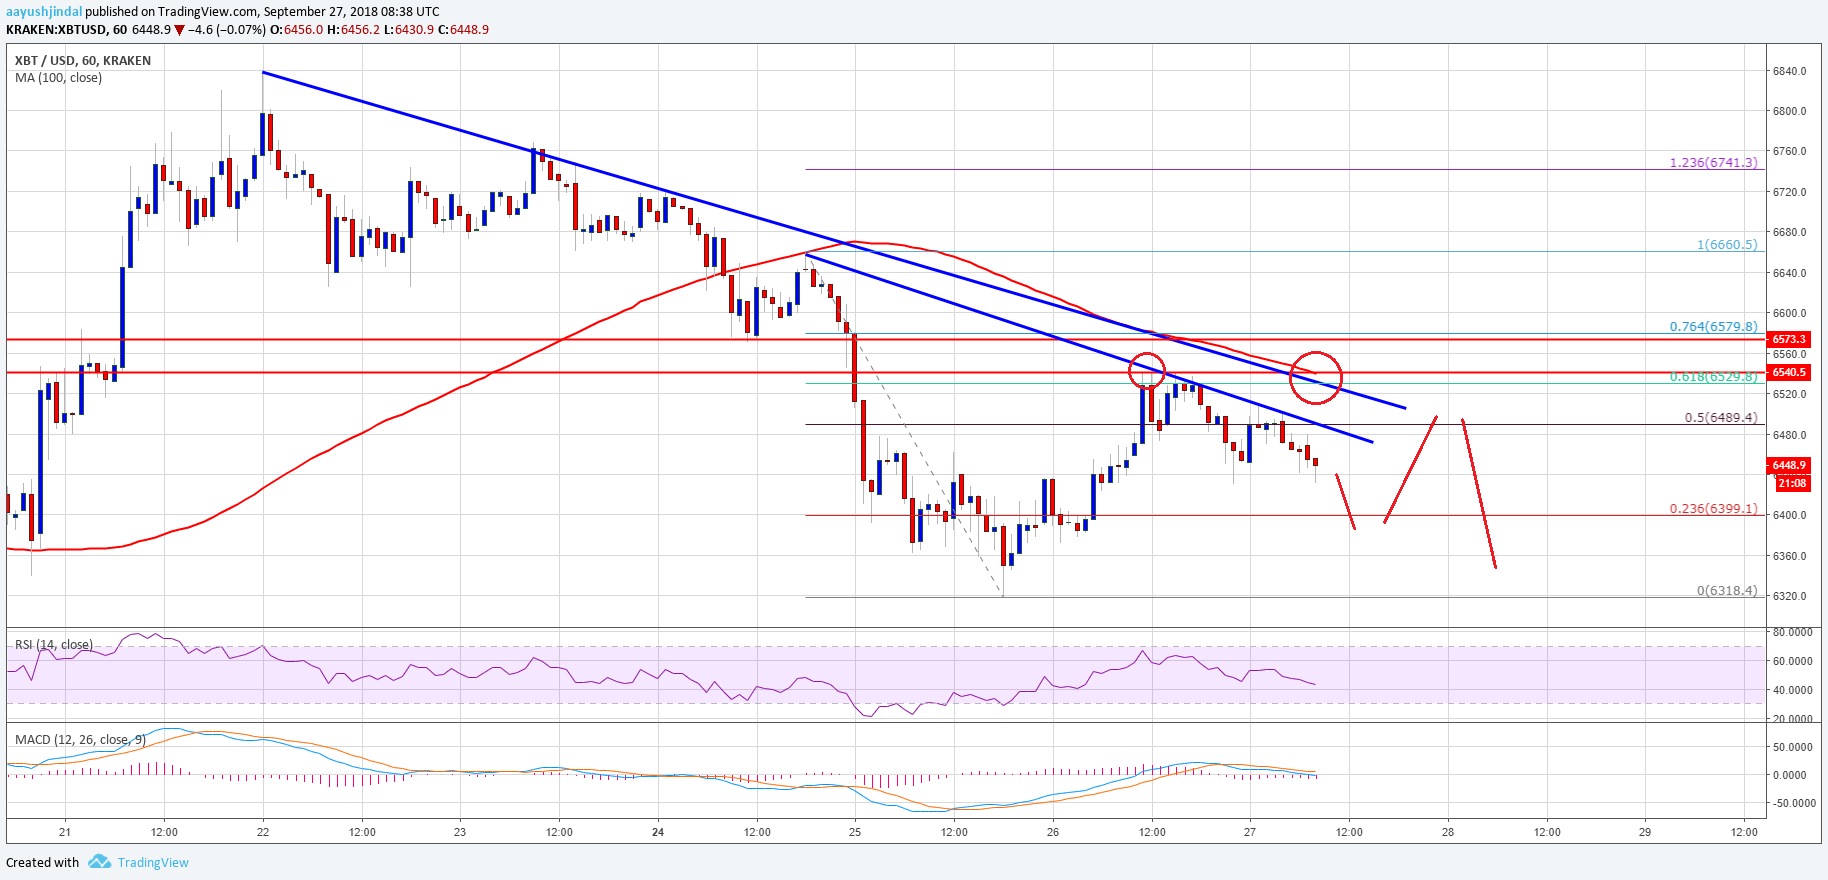
Looking at the chart, bitcoin price is clearly following a bearish bias below $6,540. On the downside, an initial support is at $6,400. If there is a break below the $6,400 support, the price may decline towards the $6,350 support. The next key support is near the recent swing low at $6,315.
Looking at the technical indicators:
Hourly MACD – The MACD for BTC/USD is slightly in the bearish zone.
Hourly RSI (Relative Strength Index) – The RSI moved below the 50 level.
Major Support Level – $6,350
Major Resistance Level – $6,540