Key Points
- Bitcoin price traded higher and cleared the $6,580-6,600 resistance zone against the US Dollar.
- There is a key bullish trend line in place with support at $6,550 on the 4-hours chart of the BTC/USD pair (data feed from Kraken).
- The pair is currently correcting lower, but it could find support near the $6,600 and $6,550 levels.
Bitcoin price climbed above the key $6,600 resistance against the US Dollar. BTC/USD needs to clear the $6,850 level to gain upside momentum in the near term.
Bitcoin Price Analysis
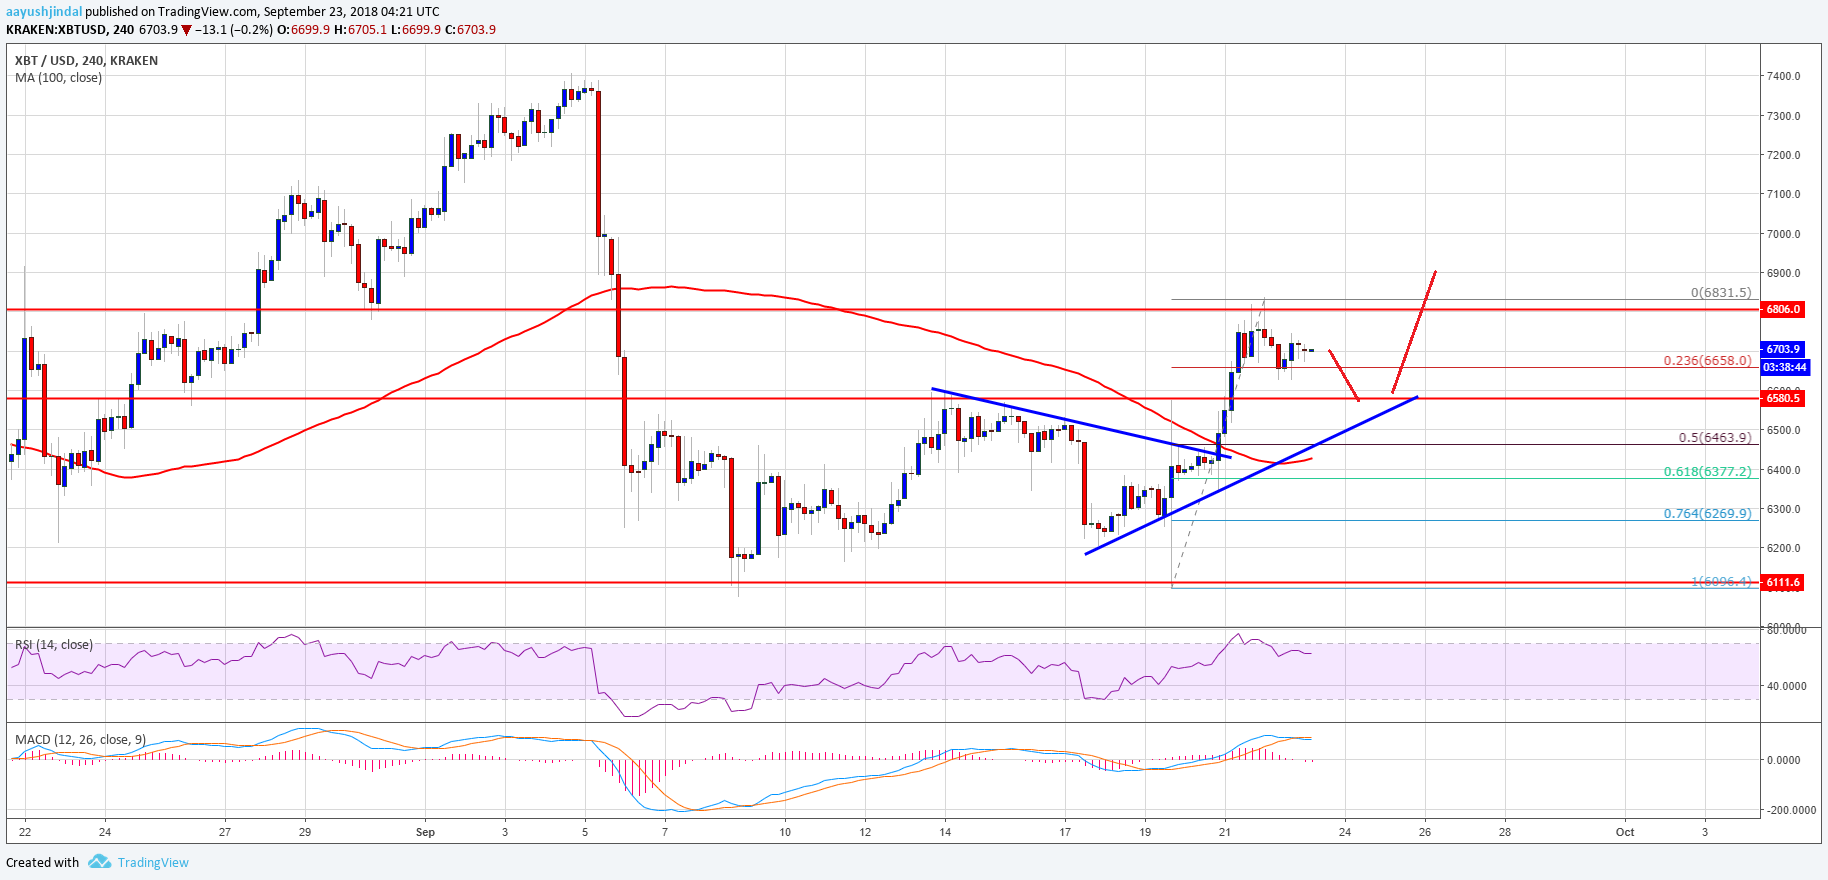
This past week, bitcoin price started a decent upward move from the $6,110 support area against the US Dollar. The BTC/USD pair traded higher and broke the $6,380 and $6,500 resistances. The best thing was a close above the $6,600 resistance and the 100 simple moving average (4-hours). The price traded above the $6,700 level and tested the next resistance zone near $6,850 (the previous support).
It traded as high as $6,831 and is currently correcting lower. At present, the 23.6% Fib retracement level of the last wave from the $6,111 low to $6,831 high is acting as a support. If the price continues to correct lower, the previous resistance at $6,600 may hold losses. There is also a key bullish trend line in place with support at $6,550 on the 4-hours chart of the BTC/USD pair. Below the trend line, the 50% Fib retracement level of the last wave from the $6,111 low to $6,831 high is at $6,460. Therefore, if the price corrects lower, it could find supports near $6,600, $6,550 and $6,450.

Looking at the chart, BTC price is facing a lot of hurdles near the $6,850 level. Above this, buyers need to surpass the $7,000 level to move into a medium term bullish zone. The final target could be $7,350 if buyers overcome $7,000.
Looking at the technical indicators:
4-hours MACD – The MACD for BTC/USD is slightly placed in the bearish zone.
4-hours RSI (Relative Strength Index) – The RSI is well above the 50 level.
Major Support Level – $6,550
Major Resistance Level – $6,850


