
Reason to trust
How Our News is Made
Strict editorial policy that focuses on accuracy, relevance, and impartiality
Ad discliamer
Morbi pretium leo et nisl aliquam mollis. Quisque arcu lorem, ultricies quis pellentesque nec, ullamcorper eu odio.
Key Points
- Bitcoin cash price declined further, but it found support near the $660 level against the US Dollar.
- This week’s highlighted key bearish trend line is still in place with current resistance near $718 on the hourly chart of the BCH/USD pair (data feed from Kraken).
- The pair must break the trend line, $720, and the 100 hourly simple moving average to gain traction.
Bitcoin cash price is slowly recovering above $680 against the US Dollar. BCH/USD has to break the 100 SMA to start a decent upside move.
Bitcoin Cash Price Resistance
There were further declines in bitcoin cash price below the $680 swing low against the US Dollar. The BCH/USD pair broke the $683 low and traded below the $675 level. It traded close to the $660 level and formed a low at $662. Later, there was a decent upward move started and the price moved above the $680 level. There was also a break above the 23.6% Fib retracement level of the last drop from the $757 high to $662 low.
However, the price is now approaching a crucial resistance near $720-725. More importantly, this week’s highlighted key bearish trend line is still in place with current resistance near $718 on the hourly chart of the BCH/USD pair. Before the trend line, the 100 hourly simple moving average is positioned near the $710 level. The 50% Fib retracement level of the last drop from the $757 high to $662 low is also below the trend line. Therefore, a proper break above $710 and the 100 SMA is needed for buyers to gain momentum.
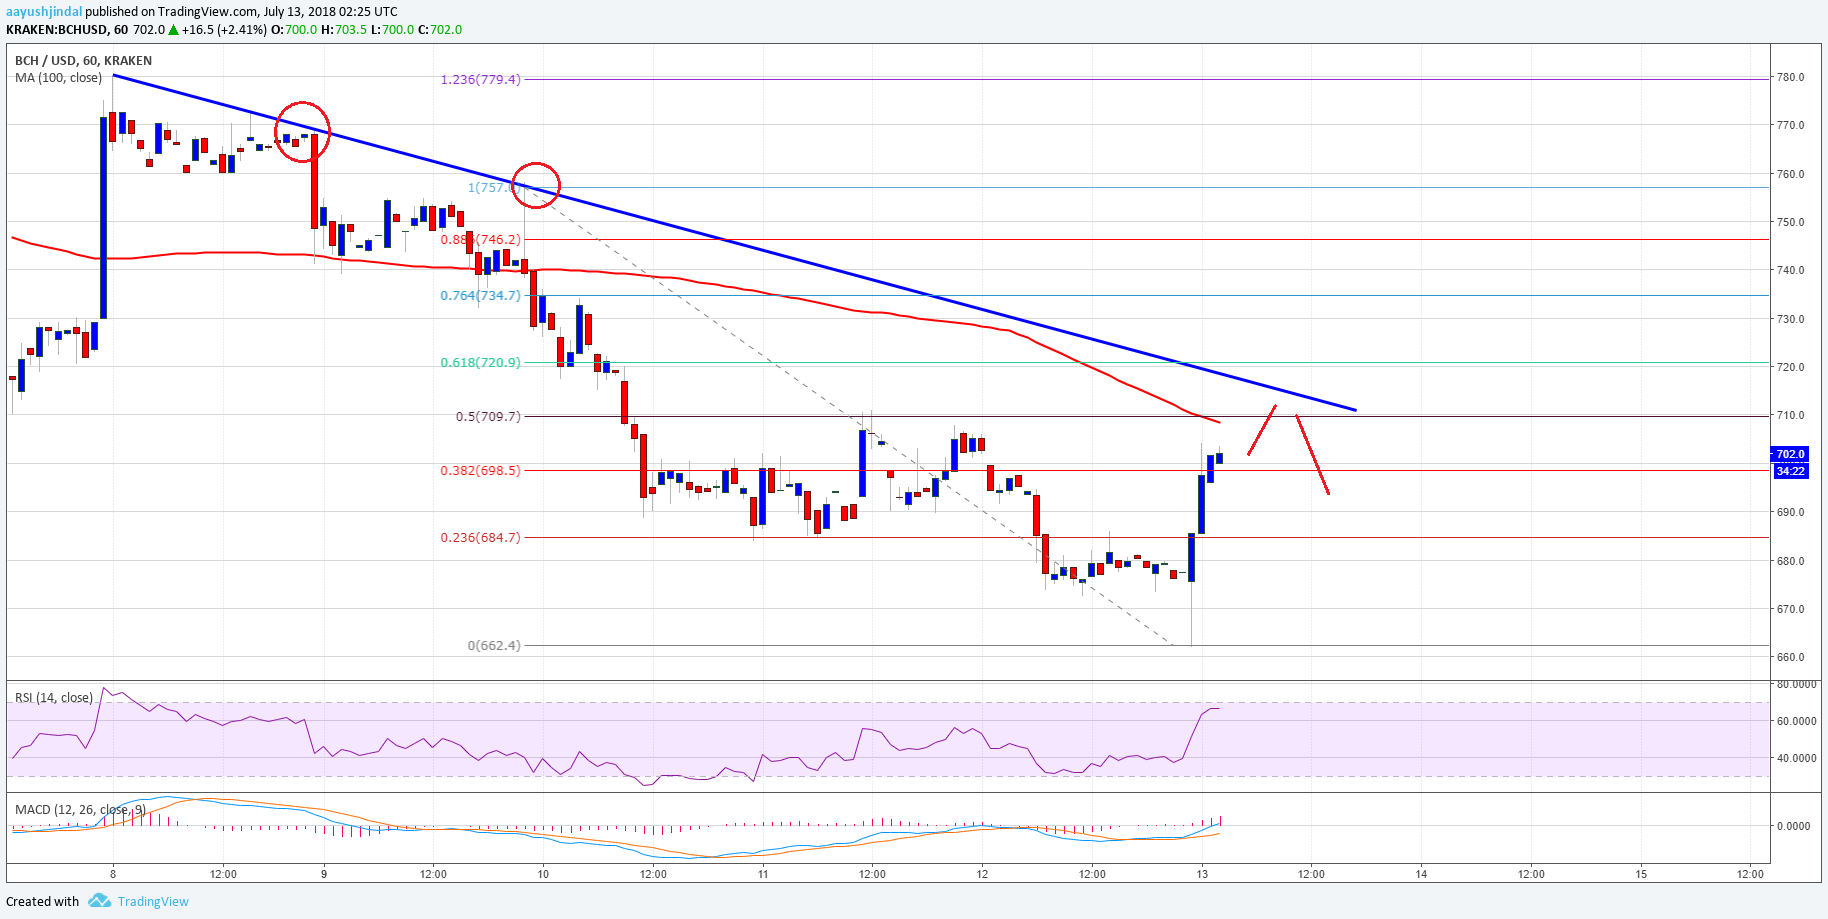
Looking at the chart, the price bounced back sharply from the $662 low. Still, a break above the trend line, $720, and the 100 SMA is must for more gains.
Looking at the technical indicators:
Hourly MACD – The MACD for BCH/USD has moved back in the bullish zone.
Hourly RSI (Relative Strength Index) – The RSI for BCH/USD is well above the 50 level.
Major Support Level – $680
Major Resistance Level – $720


