Key Points
- Bitcoin cash price corrected lower and tested the $950 support area against the US Dollar.
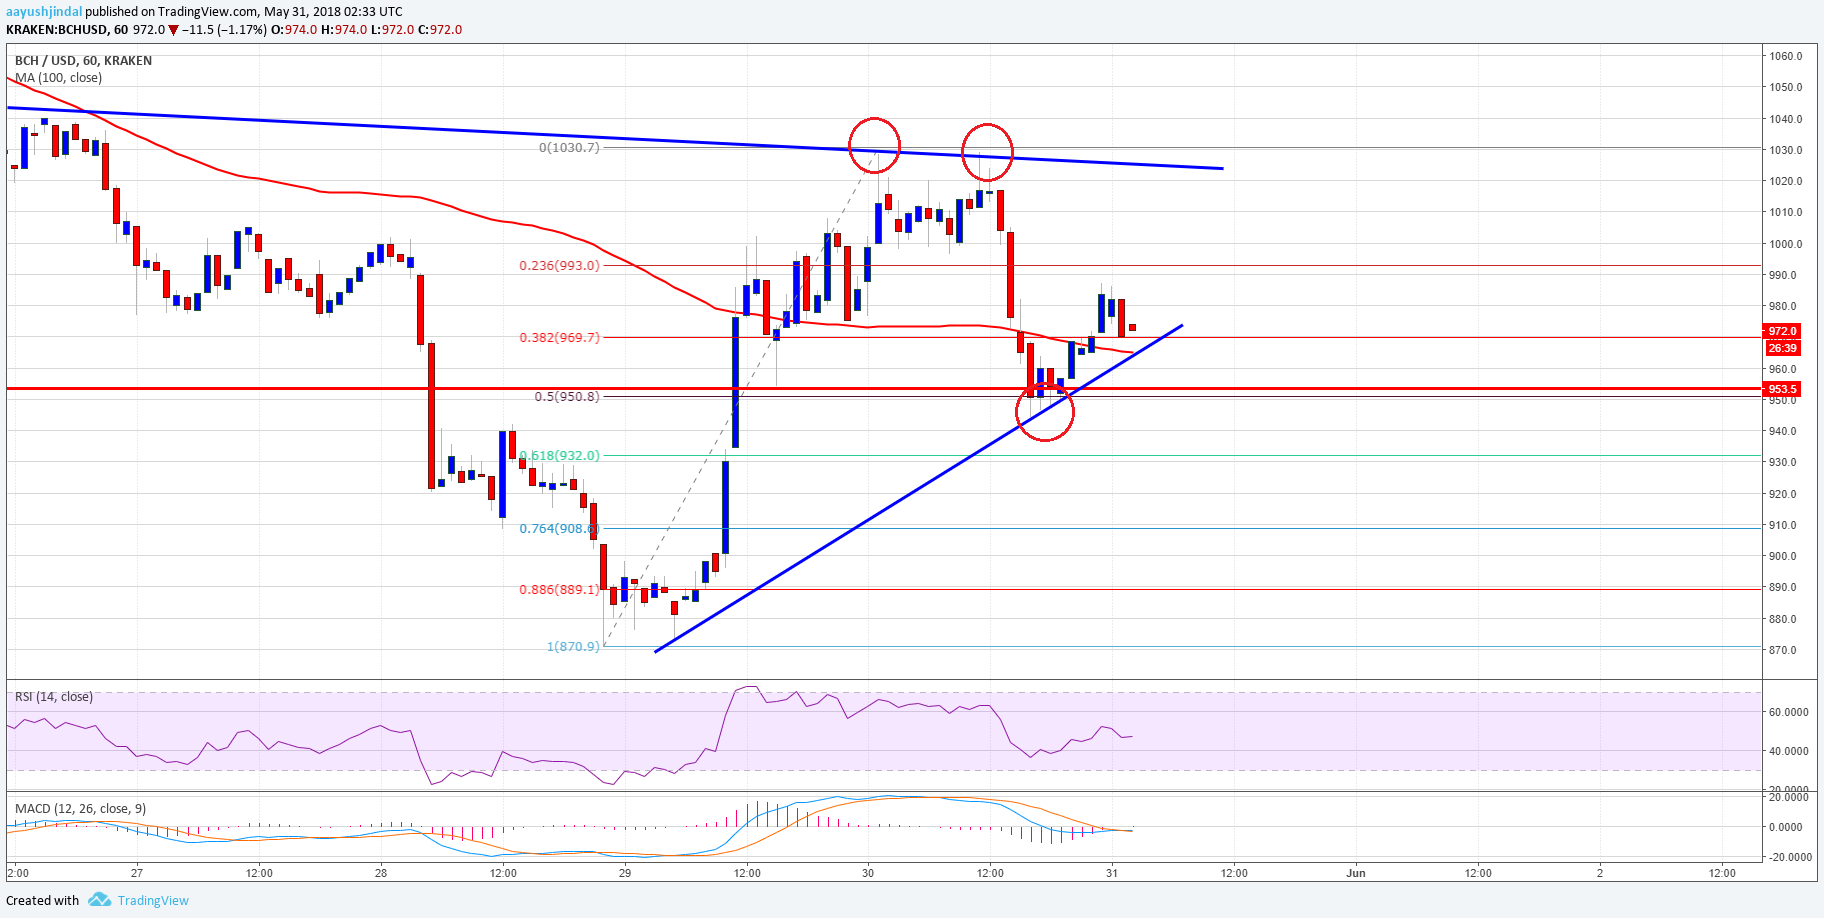
- There is a new connecting bullish trend line forming with support at $965 on the hourly chart of the BCH/USD pair (data feed from Kraken).
- The pair has to stay above the $960 and $950 support levels to avoid a downside break in the near term.
Bitcoin cash price is holding an important support around $950 against the US Dollar. BCH/USD has to move past the $1,040 resistance to gain further.
Bitcoin Cash Price Support
After yesterday’s ride, bitcoin cash price faced sellers near the $1,030-1,040 resistances against the US Dollar. The price started a downside correction and declined below the $1,000 support. It also declined below the 23.6% Fib retracement level of the last wave from the $971 low to $1,031 high. It opened the doors for a larger correction and the price dipped towards the $950 support area.
The $940-950 support area acted as a decent buy zone and protected further losses. Moreover, the 50% Fib retracement level of the last wave from the $971 low to $1,031 high also prevented declines. BCH price moved back above the $960 level and the 100 hourly simple moving average. More importantly, there is a new connecting bullish trend line forming with support at $965 on the hourly chart of the BCH/USD pair. The pair remains well supported on the downside around the $950 and $960 levels.

Looking at the chart, the price is clearly facing a major hurdle on the upside near $1,040. A break and close above the stated $1,040 resistance is needed for buyers to take control. On the downside, a break and close below $950 will most likely push the price back in the bearish zone.
Looking at the technical indicators:
Hourly MACD – The MACD for BCH/USD is slightly placed in the bullish zone.
Hourly RSI (Relative Strength Index) – The RSI for BCH/USD is currently flat near the 50 level.
Major Support Level – $950
Major Resistance Level – $1,040


