Reason to trust
How Our News is Made
Strict editorial policy that focuses on accuracy, relevance, and impartiality
Ad discliamer
Morbi pretium leo et nisl aliquam mollis. Quisque arcu lorem, ultricies quis pellentesque nec, ullamcorper eu odio.
Key Points
- Bitcoin price formed a strong base around $7,050 and moved higher against the US Dollar.
- This week’s followed important bearish trend line with resistance at $7,320 was breached on the hourly chart of the BTC/USD pair (data feed from Kraken).
- The pair is now placed nicely above the $7,400 level and the 100 hourly simple moving average.
Bitcoin price is back in action above $7,400 against the US Dollar. BTC/USD is showing positive signs above 100 SMA and is facing a key barrier near $7,500-7,600.
Bitcoin Price Analysis
The past few sessions were positive in bitcoin price as it moved above the $7,300 resistance against the US Dollar. The BTC/USD pair formed a support base at $7,050 and started a sharp upside move. It broke the 50% Fib retracement level of the last drop from the $7,450 high to $7,048 low to start the rally. Later, buyers succeeded in pushing the price above a major hurdle at $7,250.
It opened the doors for more gains and this week’s followed important bearish trend line with resistance at $7,320 was breached on the hourly chart of the BTC/USD pair. The pair settled above the $7,400 resistance and the 100 hourly simple moving average. At the moment, the price is trading near the 50% Fib retracement level of the last decline from the $7,936 high to $7,048. Buyers must push the price above the $7,500 and $7,600 resistance levels to more gains in the near term. The $7,600 level is the 61.8% Fib retracement level of the last decline from the $7,936 high to $7,048.
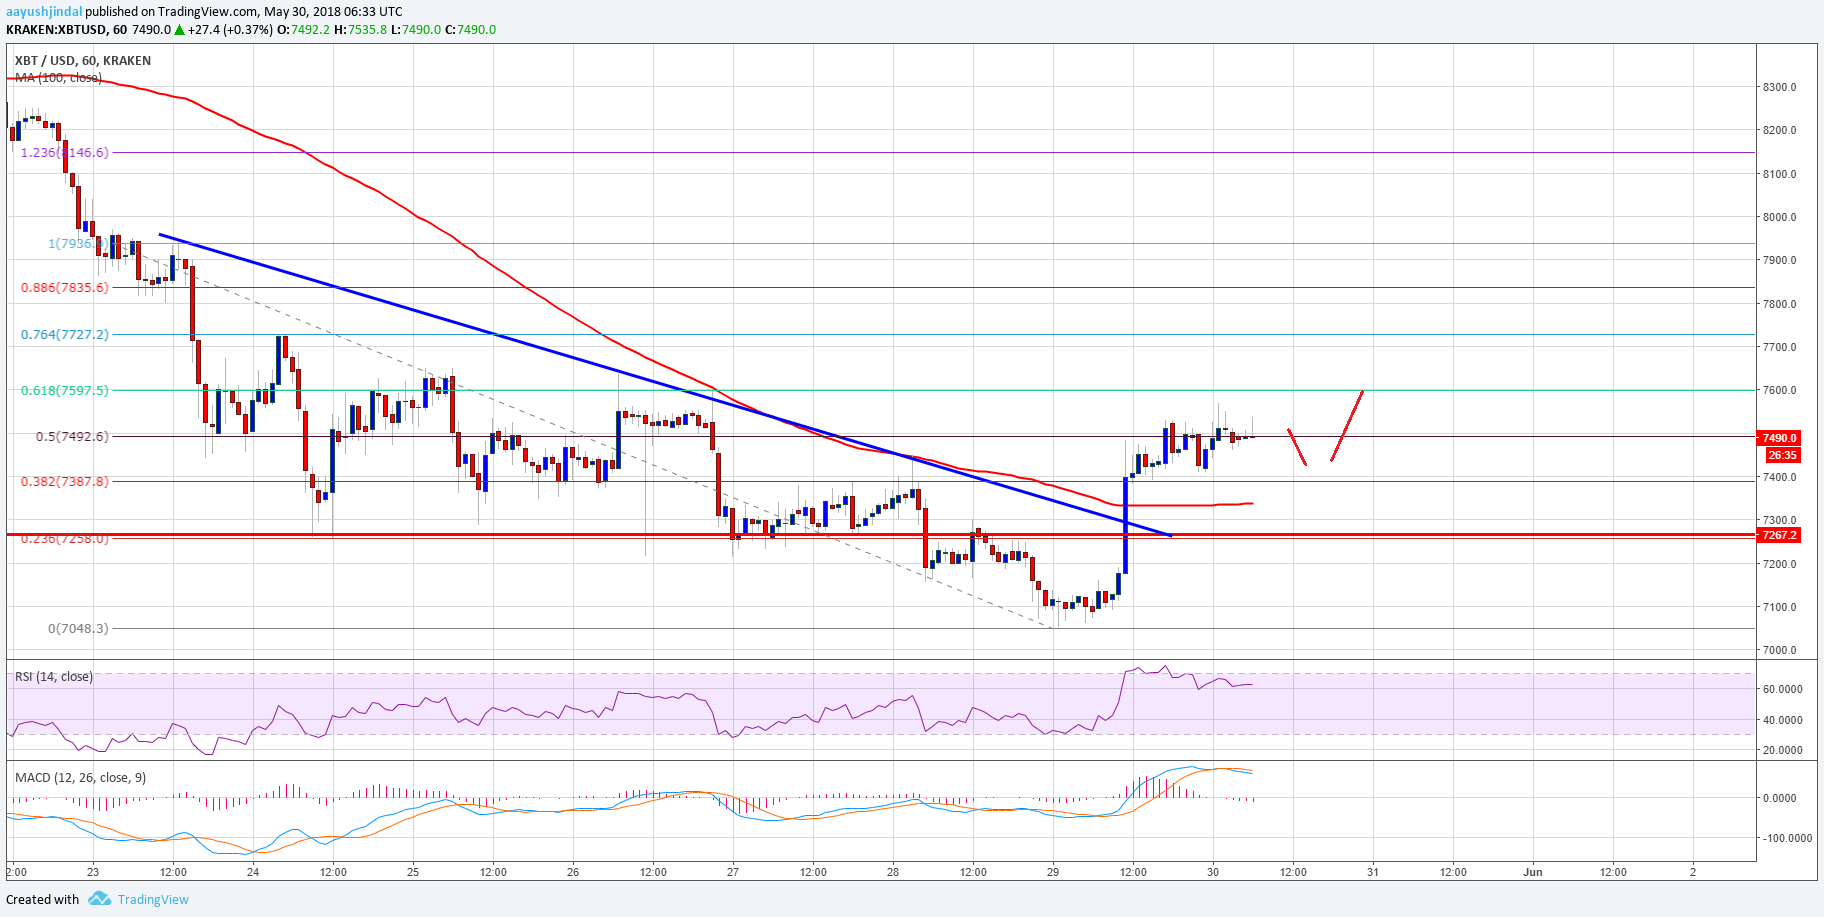
Looking at the chart, if the price breaks the $7,600 barrier, it could easily rally towards the $8,000 level. On the downside, the broken resistance at $7,300 and the 100 hourly SMA are likely to act as supports.
Looking at the technical indicators:
Hourly MACD – The MACD for BTC/USD is about to move in the bullish zone.
Hourly RSI (Relative Strength Index) – The RSI is currently placed nicely near the 60 level.
Major Support Level – $7,300
Major Resistance Level – $7,600