Key Points
- Bitcoin cash price failed to move above the $1,350 resistance and declined sharply against the US Dollar.
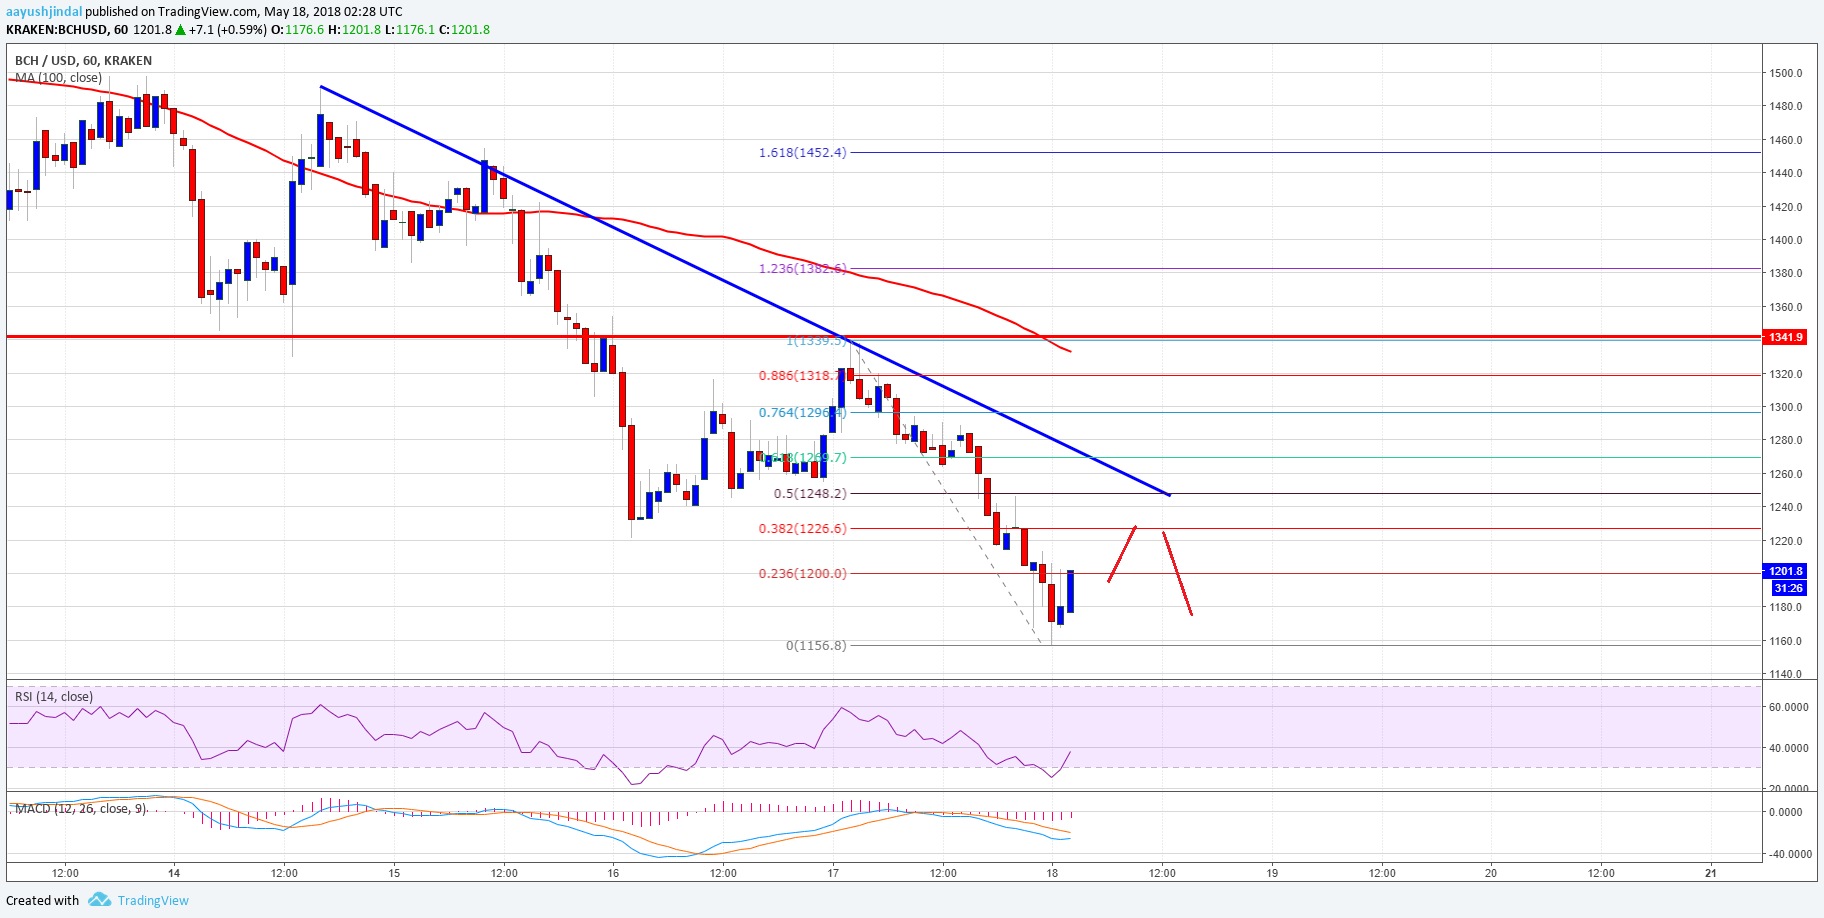
- There is a major bearish trend line formed with resistance at $1,250 on the hourly chart of the BCH/USD pair (data feed from Kraken).
- The pair is currently correcting higher, but it may face many barriers on the upside near $1,240-50.
Bitcoin cash price is under pressure below $1,300 against the US Dollar. BCH/USD is likely to extend declines further if it fails to move above $1,250.
Bitcoin Cash Price Decline
Recently, there was a minor upside correction above $1,300 in bitcoin cash price against the US Dollar. The price traded towards $1,340 where sellers appeared and protected more upsides. As a result, the price started a fresh downside move and declined back below $1,300. Sellers gained momentum, which pushed the price even below the $1,240 and $1,220 support levels.
The decline was such that the price almost tested the $1,150 level. A low was formed at $1,156 from where an upside correction is currently underway. It is currently testing the 23.6% Fib retracement level of the last drop from the $1,339 high to $1,156 low. However, there are many hurdles on the upside for buyers near $1,220-50. There is also a major bearish trend line formed with resistance at $1,250 on the hourly chart of the BCH/USD pair. Moreover, the 50% Fib retracement level of the last drop from the $1,339 high to $1,156 low is near $1,248 to act as a resistance.

Looking at the chart, the price is clearly under bearish pressure below $1,250. A break above $1,240-50 is needed for a bounce back, else there is a risk of more declines towards $1,100 in the near term.
Looking at the technical indicators:
Hourly MACD – The MACD for BCH/USD is mostly moving in the bearish zone.
Hourly RSI (Relative Strength Index) – The RSI for BCH/USD is currently recovering from the 30 level.
Major Support Level – $1,150
Major Resistance Level – $1,250


