
Reason to trust
How Our News is Made
Strict editorial policy that focuses on accuracy, relevance, and impartiality
Ad discliamer
Morbi pretium leo et nisl aliquam mollis. Quisque arcu lorem, ultricies quis pellentesque nec, ullamcorper eu odio.
Key Points
- Bitcoin cash price found support near the $1,220 level and recovered slightly against the US Dollar.
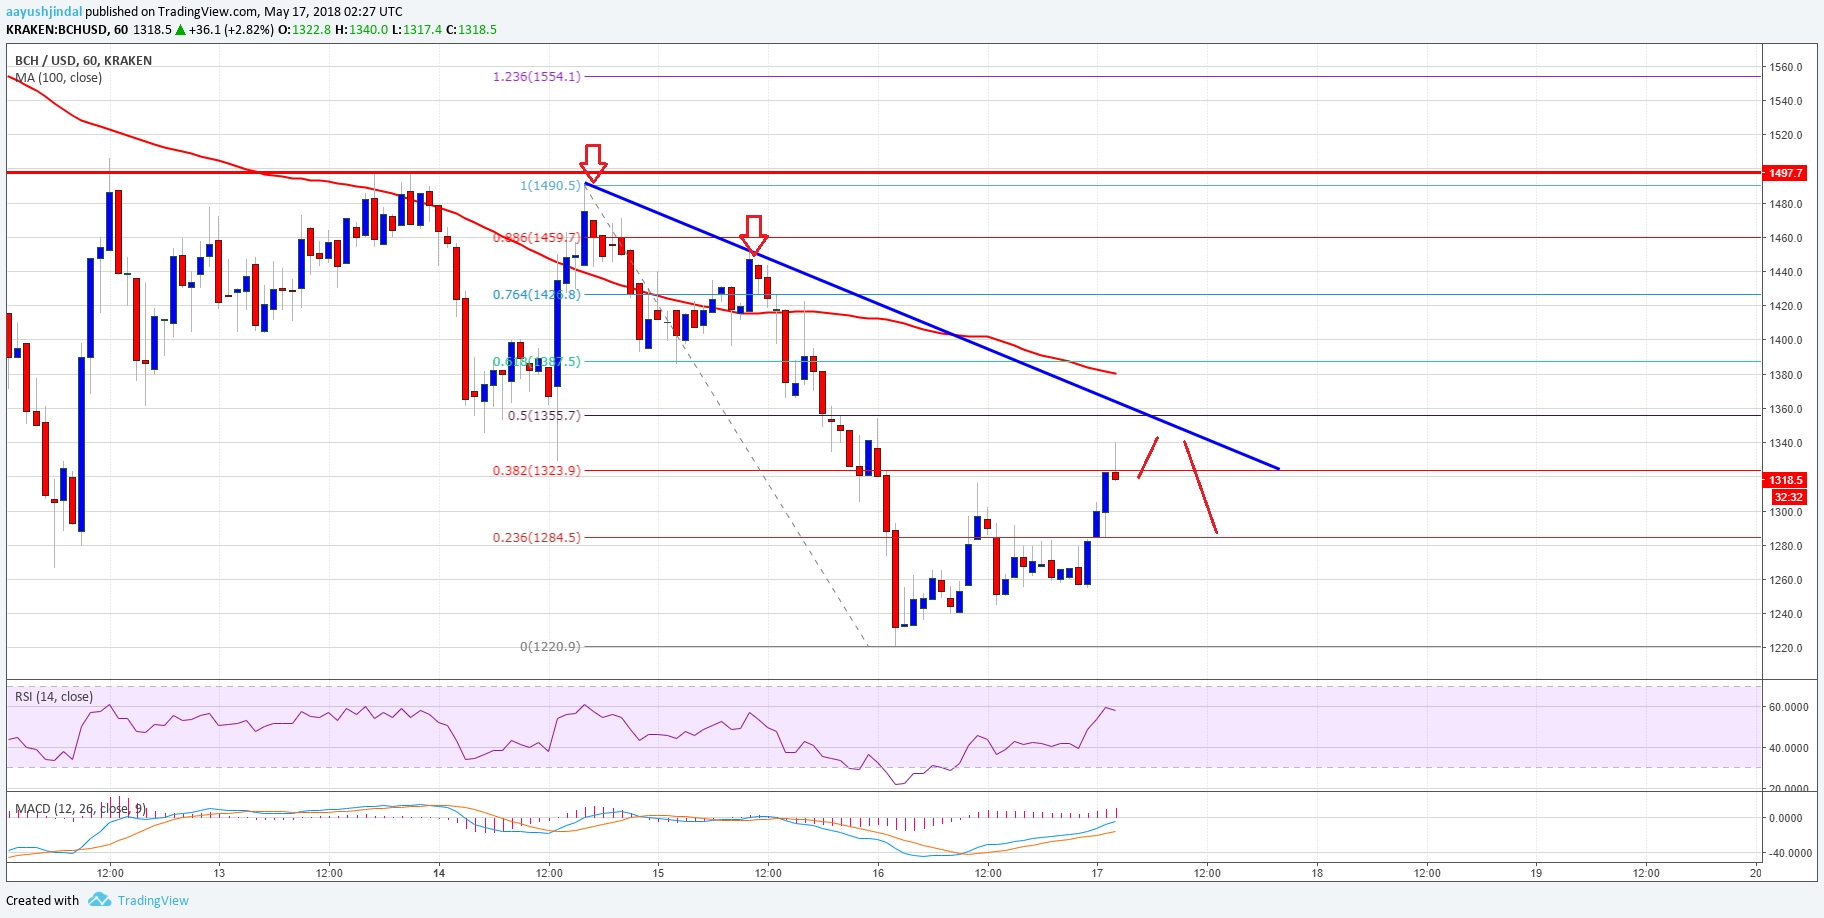
- There is a short-term bearish trend line forming with resistance at $1,340 on the hourly chart of the BCH/USD pair (data feed from Kraken).
- The pair is facing many hurdles on the upside near $1,340 and $1,350 resistance levels.
Bitcoin cash price is slowly recovering from $1,220 against the US Dollar. BCH/USD may correct in the short term, but gains above $1,350 won’t be easy.
Bitcoin Cash Price Resistance
Yesterday, there was a sharp downside move below $1,300 in bitcoin cash price against the US Dollar. The price even traded below the $1,240 support level and almost tested the $1,200 support. A low was formed near $1,220 before the price started an upside recovery. It moved above the 23.6% Fib retracement level of the last decline from the $1,490 high to $1,220 low.
It also succeeded in clearing the $1,300 resistance, but there are many barriers on the upside. There is also a short-term bearish trend line forming with resistance at $1,340 on the hourly chart of the BCH/USD pair. Moreover, the 50% Fib retracement level of the last decline from the $1,490 high to $1,220 low is placed near the $1,360 level to act as a crucial resistance. In short, it seems like there is a major barrier forming near $1,340 and $1,350 resistance levels. A break and close above $1,350 may well push the price towards the 100 hourly simple moving average, which is the next resistance before $1,400.
Looking at the chart, the price is showing positive signs above $1,240. However, a break and close above $1,350, $1,380 and $1,400 won’t be easy. On the downside, supports are seen at $1,300 and $1,240.
Looking at the technical indicators:
Hourly MACD – The MACD for BCH/USD is slowly moving in the bullish zone.
Hourly RSI (Relative Strength Index) – The RSI for BCH/USD is now above the 50 level.
Major Support Level – $1,240
Major Resistance Level – $1,350


