
Reason to trust
How Our News is Made
Strict editorial policy that focuses on accuracy, relevance, and impartiality
Ad discliamer
Morbi pretium leo et nisl aliquam mollis. Quisque arcu lorem, ultricies quis pellentesque nec, ullamcorper eu odio.
Key Points
- Bitcoin price formed a support base around $9,000 and jumped higher against the US Dollar.
- There was a break above a crucial declining channel with resistance at $9,200 on the hourly chart of the BTC/USD pair (data feed from Kraken).
- The pair is currently struggling to settle above $9,400 and the 100 hourly simple moving average.
Bitcoin price is showing positive signs above $9,200 against the US Dollar. BTC/USD has to settle above the 100 hourly SMA to climb above $9,500 in the near term.
Bitcoin Price Trend
After a downside correction, bitcoin price found a strong buying interest near the $9,000 level against the US Dollar. The price formed a low at $8,969 and started an upside move. It climbed higher and cleared the 23.6% Fib retracement level of the last drop from the $9,959 high to $8,969 low. It opened the doors for more upsides and the price broke a couple of key hurdles near $9,180 and $9,200.
More importantly, there was a break above a crucial declining channel with resistance at $9,200 on the hourly chart of the BTC/USD pair. The pair tested the next major resistance at $9,450 and the 100 hourly simple moving average. It seems like buyers struggled to break the $9,450 resistance since it is the 50% Fib retracement level of the last drop from the $9,959 high to $8,969 low. It is currently consolidating gains near the $9,350 level and the 100 hourly SMA. Once there is a successful close above 100 SMA and $9,450, the price may resume its uptrend.
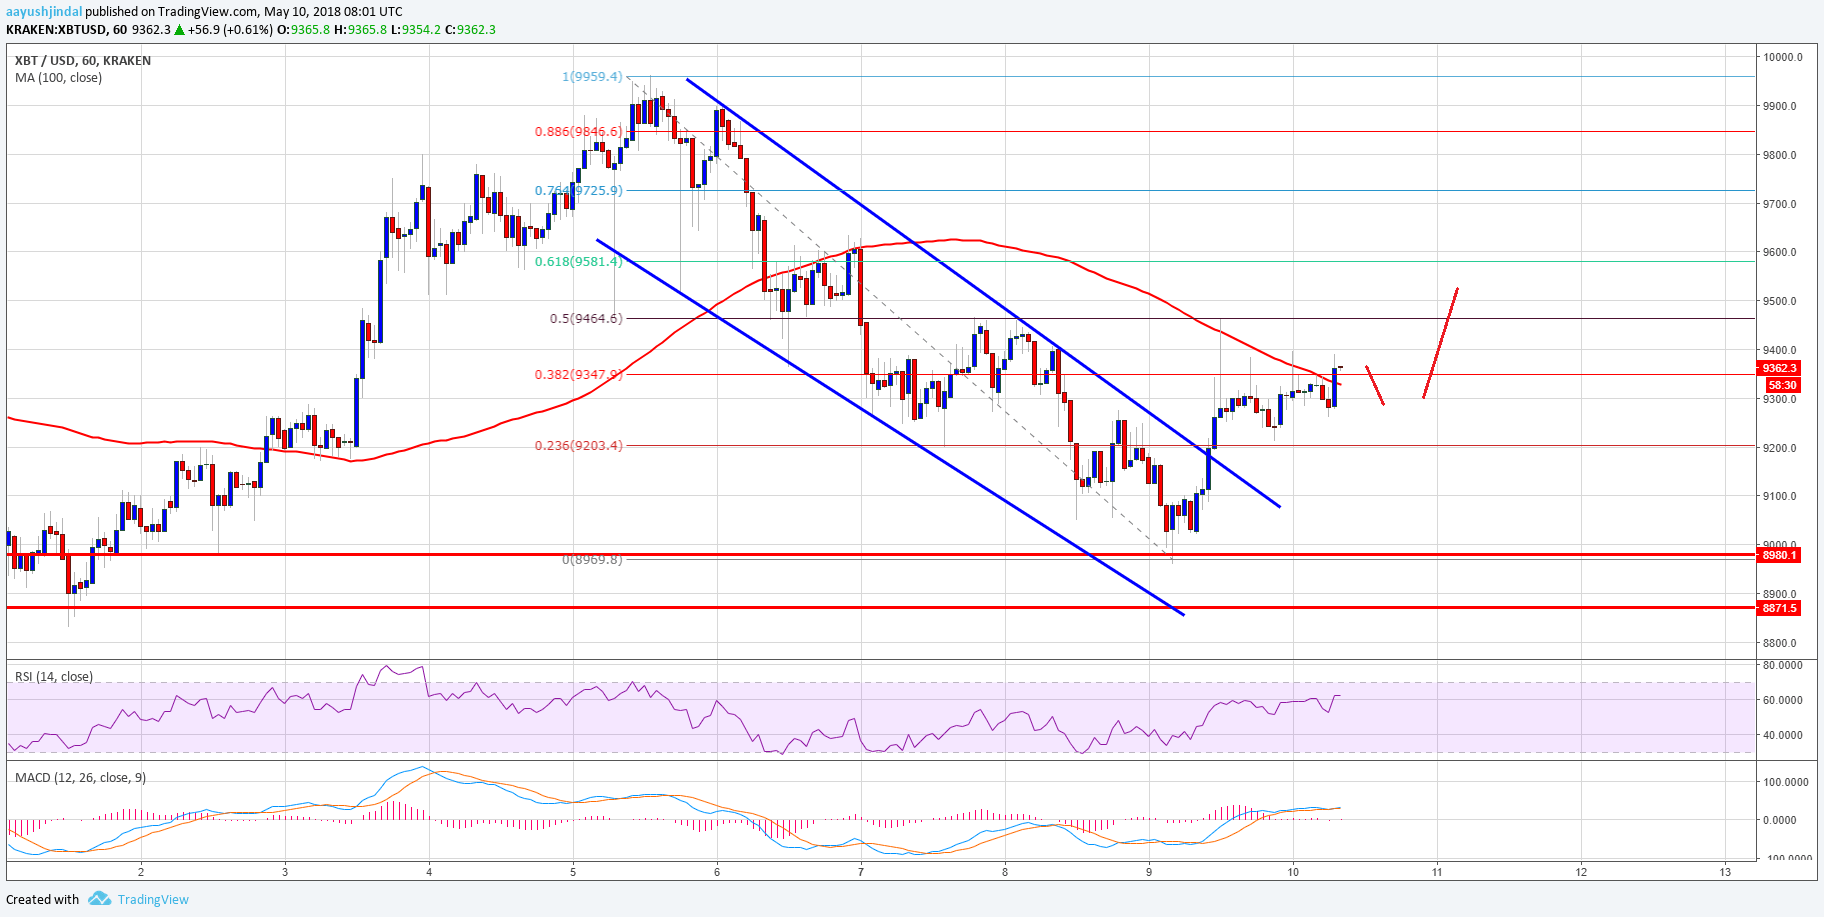
Looking at the chart, there are many positive signs above the $9,200 support. As long as the price is stable and holds the bullish bias above $9,200, it is likely to break $9,450. The next stop for buyers could be $9,600 and $9,750.
Looking at the technical indicators:
Hourly MACD – The MACD for BTC/USD is slowly moving in the bullish zone.
Hourly RSI (Relative Strength Index) – The RSI is now well above the 50 level.
Major Support Level – $9,200
Major Resistance Level – $9,450


