
Reason to trust
How Our News is Made
Strict editorial policy that focuses on accuracy, relevance, and impartiality
Ad discliamer
Morbi pretium leo et nisl aliquam mollis. Quisque arcu lorem, ultricies quis pellentesque nec, ullamcorper eu odio.
Key Points
- Bitcoin cash price extended its downside move and traded below the $1,350 support against the US Dollar.
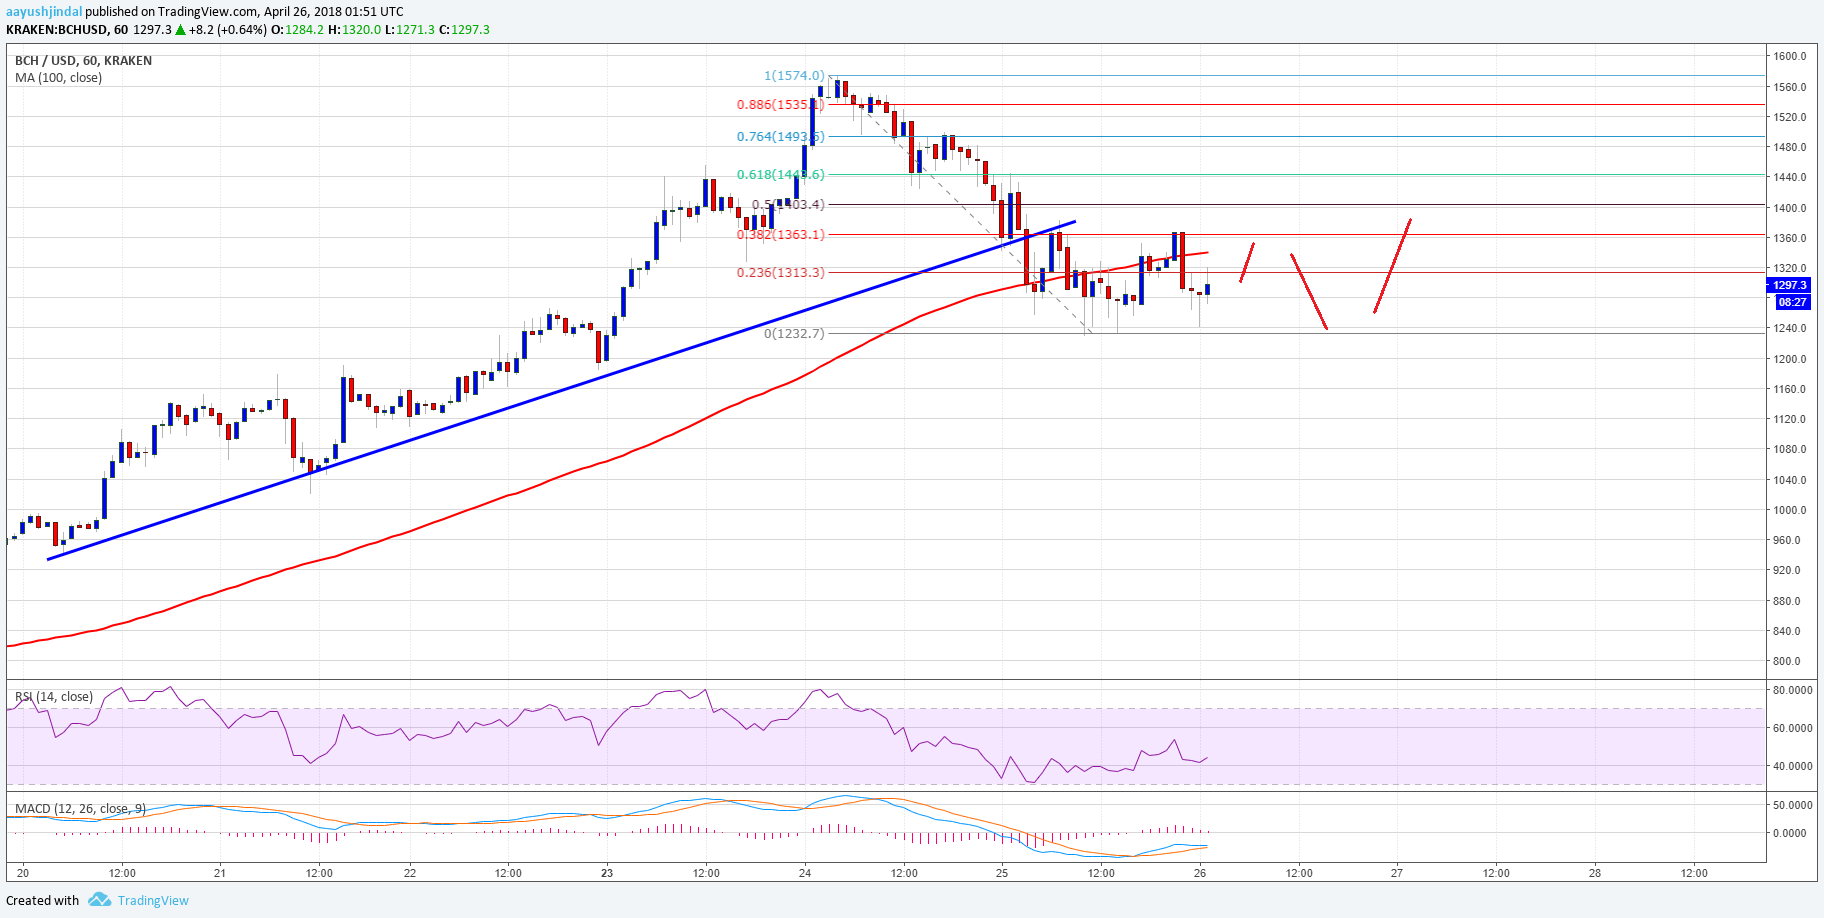
- Yesterday’s highlighted crucial bullish trend line with support near $1,355 was breached on the hourly chart of the BCH/USD pair (data feed from Kraken).
- The pair is now consolidating losses above the $1,240 level and it remains at a risk of more declines.
Bitcoin cash price moved down further below $1,300 against the US Dollar. BCH/USD broke a key support and it may now extend its decline in the near term.
Bitcoin Cash Price Resistance
There was a fresh downside move started from the $1,574 high in bitcoin cash price against the US Dollar. The price declined and broke many supports yesterday near $1,400 and $1,360. More importantly, there was a break below the $1,350 pivot level, which ignited further gains. BCH sellers even succeeded in pushing the price below $1,300 and the 100 hourly simple moving average.
The trend change move was a break below yesterday’s highlighted crucial bullish trend line with support near $1,355 on the hourly chart of the BCH/USD pair. The pair traded as low as $1,232 and is currently consolidating losses. On the upside, an initial resistance is near $1,320 and the 100 hourly simple moving average. The next resistance is near the 38.2% Fib retracement level of the last drop from the $1,574 high to $1,232 low at $1,360. The stated $1,360 level was a support earlier and now it may prevent upsides.
Looking at the chart, it seems like the price may consolidate around $1,300 for some time. There is a chance of a downside spike towards $1,200 before the price makes an upside move. On the upside, a break above $1,360-1,400 is needed for a test of $1,500.
Looking at the technical indicators:
Hourly MACD – The MACD for BCH/USD is mostly in the bearish zone.
Hourly RSI (Relative Strength Index) – The RSI for BCH/USD is now below the 50 level.
Major Support Level – $1,200
Major Resistance Level – $1,360