
Reason to trust
How Our News is Made
Strict editorial policy that focuses on accuracy, relevance, and impartiality
Ad discliamer
Morbi pretium leo et nisl aliquam mollis. Quisque arcu lorem, ultricies quis pellentesque nec, ullamcorper eu odio.
Key Highlights
- ETH price is trading near a major support at $495-500 against the US Dollar with positive signs.
- There is an important bullish trend line forming with support at $500 on the hourly chart of ETH/USD (data feed via Kraken).
- The pair must stay above the $495 support and the 100 hourly simple moving average to continue higher.
Ethereum price is holding gains against the US Dollar and Bitcoin. ETH/USD is currently above $500 and is eyeing an upside break in the near term.
Ethereum Price Trend
There was a minor downside reaction in ETH price after it made a new monthly high at $538.34 against the US Dollar. The price declined and traded below the $525 support to test the $500 zone. During the decline, there was a break below the 50% Fib retracement level of the last leg from the $481 low to $538 high. However, the downside move was protected by the $500 support zone and the 100 hourly simple moving average.
Moreover, there is also an important bullish trend line forming with support at $500 on the hourly chart of ETH/USD. The trend line support at $500 and 100 hourly SMA are strong supports on the downside. At the moment, the price is trading near the 23.6% Fib retracement level of the last decline from the $538 high to $497 low. To initiate a fresh upside wave, buyers need to break the $515-517 resistance area. The stated $517 level is the 50% Fib retracement level of the last decline from the $538 high to $497 low. A successful push above the $517 level will most likely take the price towards $540 in the near term.
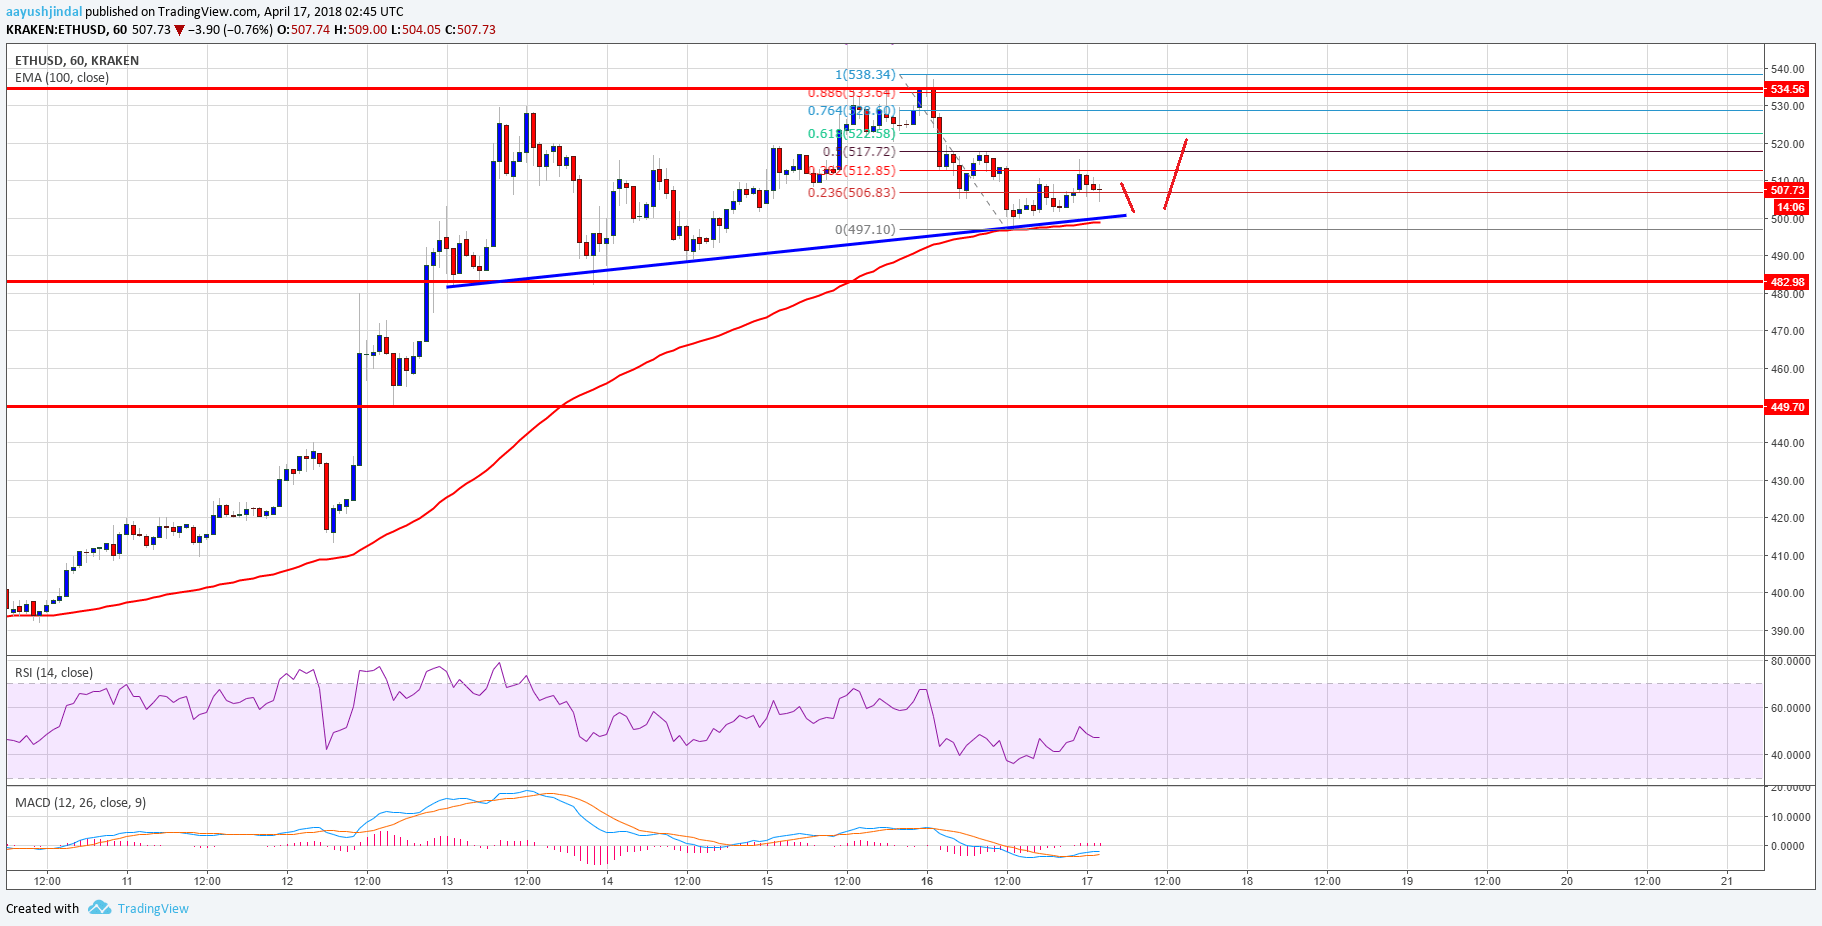
Looking at the chart, there are many positive signs since the price is holding the $500 level and the 100 hourly SMA. A break below 100 hourly SMA may perhaps drag the price towards $480.
Hourly MACD – The MACD is slowly moving in the bullish zone.
Hourly RSI – The RSI is currently just below the 50 level.
Major Support Level – $500
Major Resistance Level – $517