
Reason to trust
How Our News is Made
Strict editorial policy that focuses on accuracy, relevance, and impartiality
Ad discliamer
Morbi pretium leo et nisl aliquam mollis. Quisque arcu lorem, ultricies quis pellentesque nec, ullamcorper eu odio.
Key Points
- Bitcoin price surged higher this past week and broke $7,500 resistance against the US Dollar.
- There was a break above a key bearish trend line with resistance at $7,600 on the 4-hours chart of the BTC/USD pair (data feed from Kraken).
- The pair is currently trading above $8,000 and is facing a monster resistance near the $8,500 level.
Bitcoin price is trading in a bullish zone above $7,500 against the US Dollar. BTC/USD has to move above $8,500 to extend gains in the near term.
Bitcoin Price Trend
This past week, there was a sharp upside move in bitcoin price from the $6,800 swing low against the US Dollar. The price surged higher and broke many resistances on the way up such as $7,000 and $7,500. There was also a break above the 38.2% Fib retracement level of the last decline from the $9,025 swing high to $6,450 swing low, which is a positive sign.
More importantly, there was a break above a key bearish trend line with resistance at $7,600 on the 4-hours chart of the BTC/USD pair. The pair is now trading well above the $7,000 level and the 100 simple moving average (4-hours). Furthermore, the price settled above the 61.8% Fib retracement level of the last decline from the $9,025 swing high to $6,450 swing low. However, it is facing a monster hurdle on the upside near the $8,500 level. It acted as a support earlier and the stated $8,500 will most likely prevent upsides in the near term. If BTC buyers succeed in pushing the price above the $8,500 level, there could be a test of the last swing high near $9,025.
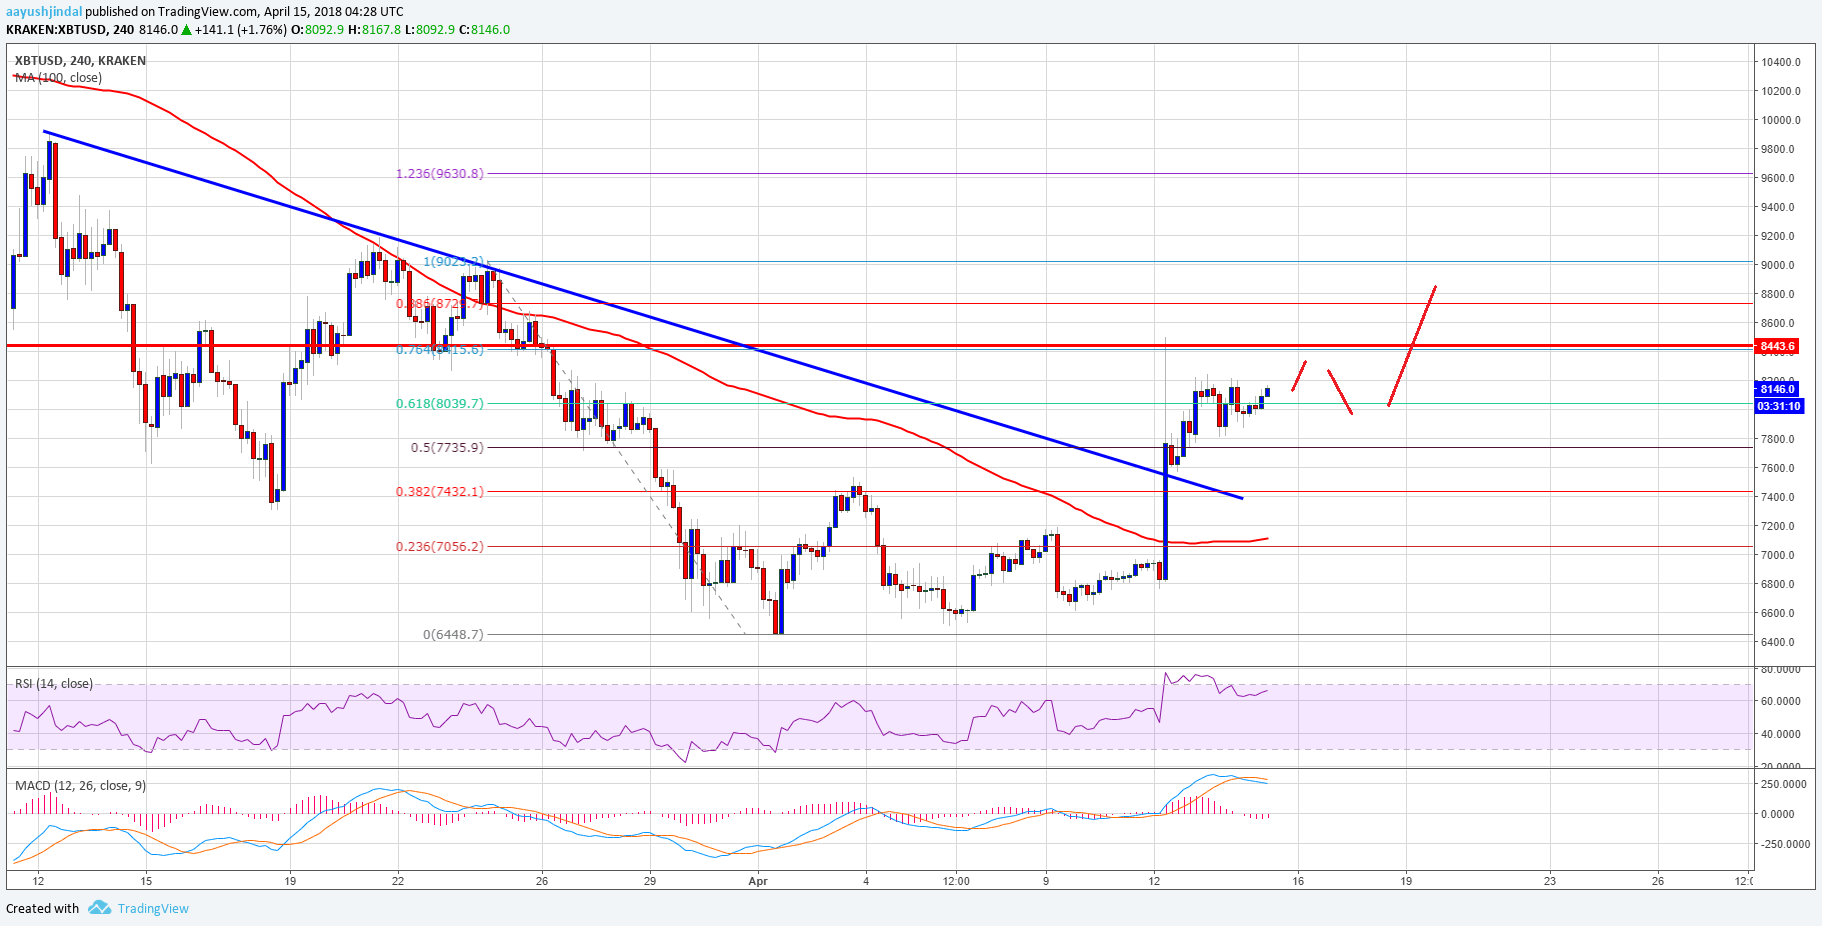
Looking at the chart above, the pair is positioned nicely above the $7,500 pivot level. It may continue to trade higher if it succeeds in clearing the $8,500 barrier. On the downside, supports are visible near $7,800, $7,600 and $7,500.
Looking at the technical indicators:
4-hours MACD – The MACD for BTC/USD is placed nicely with positive signs.
4-hours RSI (Relative Strength Index) – The RSI is currently well above the 60 level.
Major Support Level – $7,500
Major Resistance Level – $8,500