Reason to trust

How Our News is Made
Strict editorial policy that focuses on accuracy, relevance, and impartiality
Ad discliamer
Morbi pretium leo et nisl aliquam mollis. Quisque arcu lorem, ultricies quis pellentesque nec, ullamcorper eu odio.
Key Highlights
- ETH price is under a lot of selling pressure and it remains below the $750 level against the US Dollar.
- There is a key connecting bearish trend line forming with resistance at $710 on the 4-hours chart of ETH/USD (data feed via Kraken).
- The pair remains in a downtrend and it could even break the $660 and $650 support levels.
Ethereum price is trading in a negative zone against the US Dollar and Bitcoin. ETH/USD may continue to face sellers and it could soon trade towards $600.
Ethereum Price Downtrend
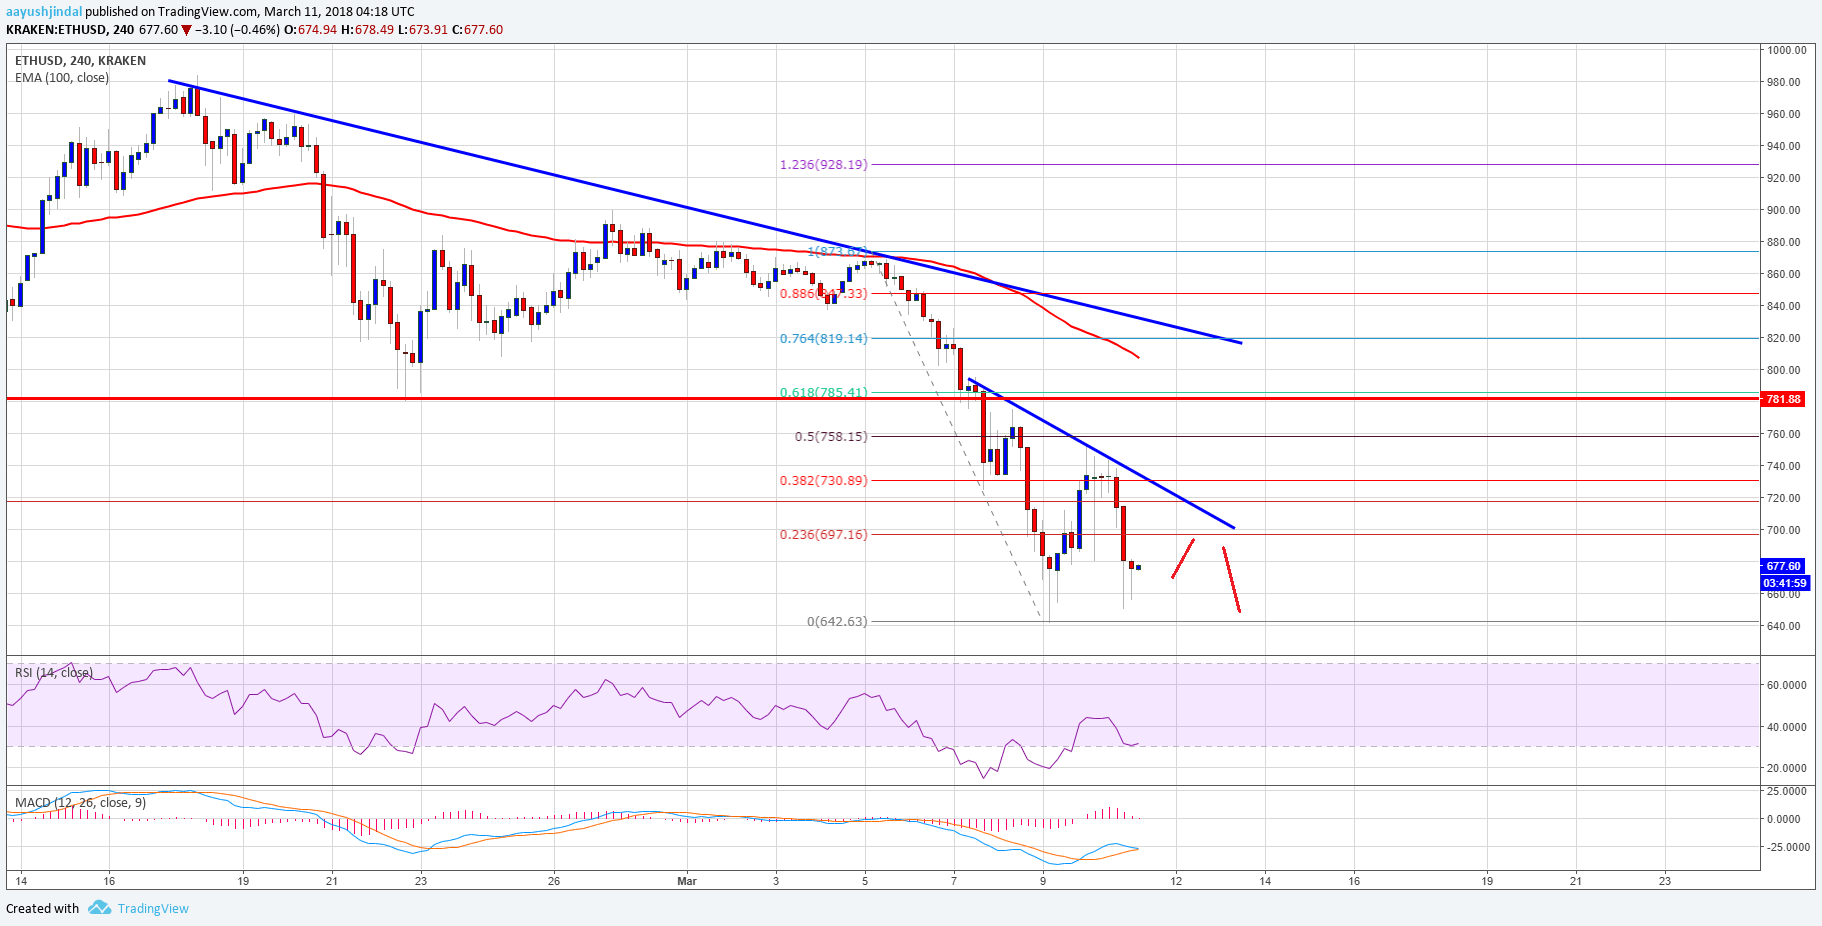
There was a nasty decline in ETH price from well above $800 this past week against the US Dollar. The price started a downside move and traded below the $800 and $700 support levels. The downside pressure was aggressive and the price traded as low as $642.63. A recovery wave was initiated from the mentioned low, but the recovery was capped by the $740 level.
It moved above the 23.6% Fib retracement level of the last drop from the $873 high to $642 low. However, buyers were not able to push the price above the $740-750 resistance. Moreover, there was a failure near the 50% Fib retracement level of the last drop from the $873 high to $642 low. There was a major rejection noted from the $750 level and the price declined. On the upside, there is also a key connecting bearish trend line forming with resistance at $710 on the 4-hours chart of ETH/USD.

As long as the price is below the trend line and $720, it remains in a downtrend. Further to the topside, there is another bearish trend line with current resistance at $820. On the downside, the recent low near $642 is a short term support. A push below $642 could take the price towards $600.
4-hours MACD – The MACD is moving back in the bearish.
4-hours RSI – The RSI is currently near the 30 level.
Major Support Level – $600
Major Resistance Level – $720
Charts courtesy – Trading View


