
Reason to trust
How Our News is Made
Strict editorial policy that focuses on accuracy, relevance, and impartiality
Ad discliamer
Morbi pretium leo et nisl aliquam mollis. Quisque arcu lorem, ultricies quis pellentesque nec, ullamcorper eu odio.
Key Points
- Bitcoin price declined this past week and moved below the $10,000 level against the US Dollar.
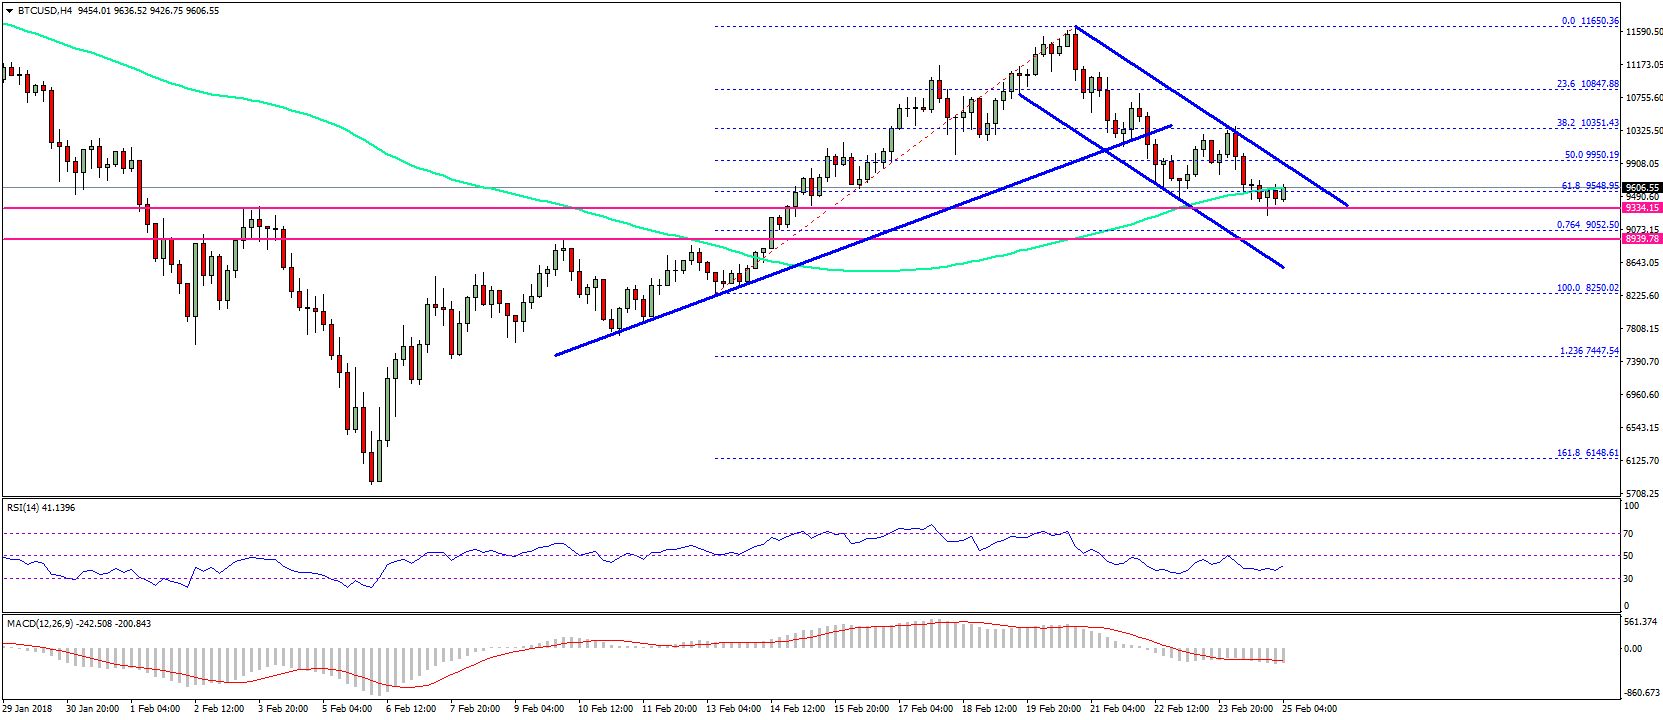
- There was a break below a major bullish trend line with support at $10,350 on the 4-hours chart of the BTC/USD pair (data feed from SimpleFX).
- The pair must stay above the $9,300 and $9,000 support levels to avoid further declines in the near term.
Bitcoin price is under pressure below the $10,000 level against the US Dollar. BTC/USD remains at a risk of more declines if the pair fails to hold the $9,000 support.
Bitcoin Price Resistance
This past week, there was an increase in bearish pressure on bitcoin price from the $10,800 swing high against the US Dollar. The price started a downside move and traded below the $10,500 support level. There was also a break below the 23.6% Fib retracement level of the last wave from the $8,250 low to $11,650 high. Moreover, there was a break below a major bullish trend line with support at $10,350 on the 4-hours chart of the BTC/USD pair.
The pair traded towards the $9,400 support and declined below the 100 simple moving average (4-hours). More importantly, there was a break below the 50% Fib retracement level of the last wave from the $8,250 low to $11,650 high. It has opened the doors for more losses below $10,000. On the downside, the $9,350 support is holding losses and is preventing declines. Should there be a break below $9,350, the price may even decline below the $9,000 level. An intermediate support is near the 76.4% Fib retracement level of the last wave from the $8,250 low to $11,650 high.
On the upside, a break above the $10,000 resistance is needed for the price to move back in the bullish zone.
Looking at the technical indicators:
4-hours MACD – The MACD for BTC/USD is currently in the bearish zone.
4-hours RSI (Relative Strength Index) – The RSI is currently well below the 50 level.
Major Support Level – $9,350
Major Resistance Level – $10,000
Charts courtesy – SimpleFX


SOS different day. Draw lines on a chart and prognosticate.