Key Highlights
- ETH price started a downside correction from the $1415 swing high against the US Dollar.
- There was a break above a key bearish trend line with resistance at $1310 on the hourly chart of ETH/USD (data feed via SimpleFX).
- The pair has to stay above the $1290-1300 levels to stay in the bullish zone for an upside move.
Ethereum price is still in the bullish zone against the US Dollar and Bitcoin. ETH/USD could continue to move higher back towards the $1360 level.
Ethereum Price Support
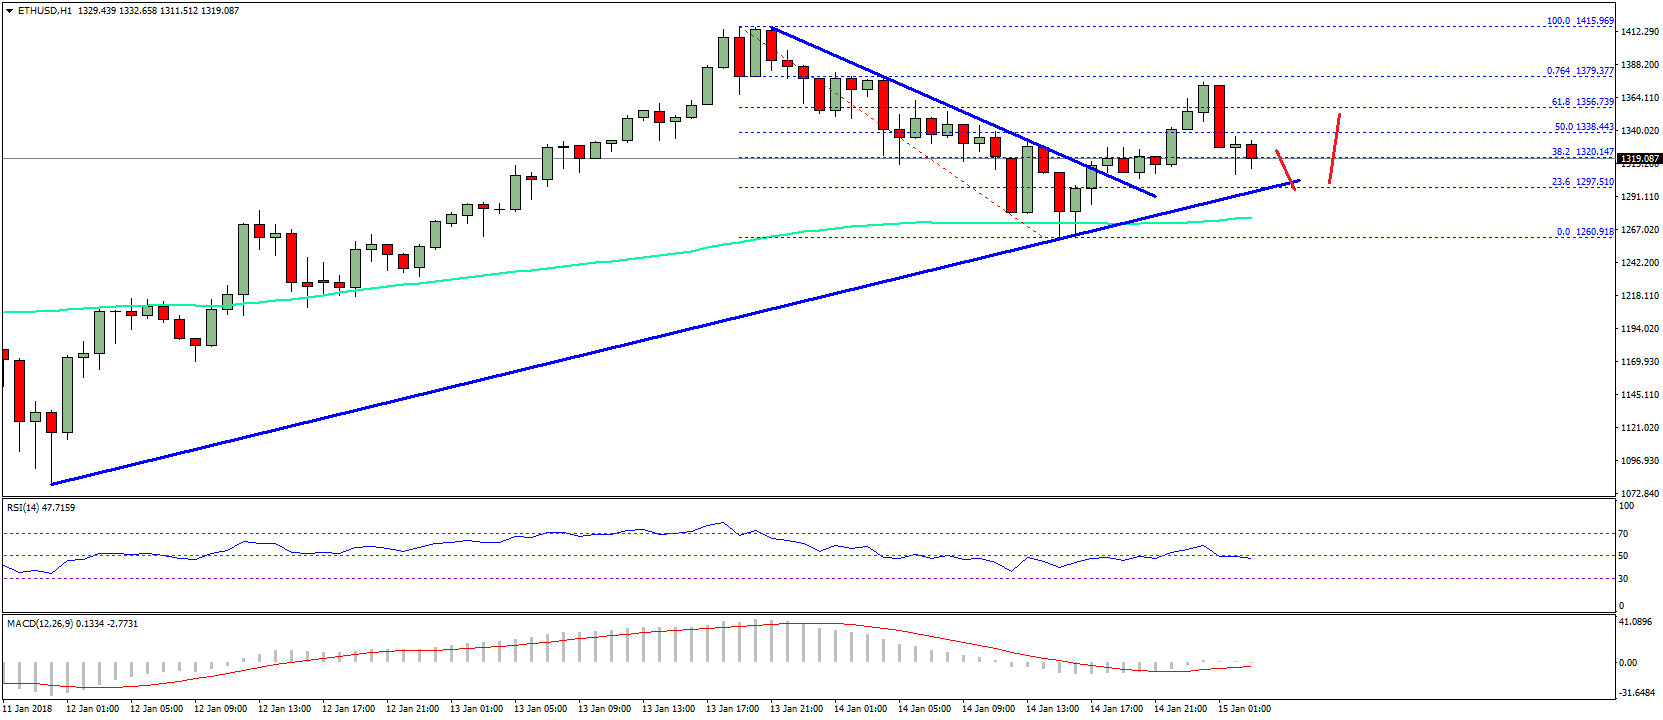
There was a decent movement in ETH price above the $1300 level against the US Dollar. The price started a minor downside correction after trading as high as $1415. It traded lower and moved below the $1360 and $1300 support levels. However, the downside move was protected by the $1260 level and the 100 hourly simple moving average. Later, the price started moving higher and was able to move back above the $1300 level.
There was a break above the 38.2% Fib retracement level of the last decline from the $1415 high to $1260 low. Moreover, there was a break above a key bearish trend line with resistance at $1310 on the hourly chart of ETH/USD. The pair is now trading nicely above the $1300 level and the 100 hourly simple moving average. On the downside, there is a bullish trend line with support at $1298. As long as the price is above the $1298 level and the 100 hourly simple moving average, it remains in an uptrend.

On the upside, the price has to close above the 61.8% Fib retracement level of the last decline from the $1415 high to $1260 low at $1350. The overall bias is positive above the $1298-1300 levels.
Hourly MACD – The MACD is slowly moving back in the bullish zone.
Hourly RSI – The RSI is currently just below the 50 level.
Major Support Level – $1300
Major Resistance Level – $1350
Charts courtesy – SimpleFX


Have followed Aayush since ETH was below 100 and always find his info to be spot on. Great post.