Key Highlights
- Ripple price remained in a bearish trend and it traded below the $1.60 support against the US Dollar.
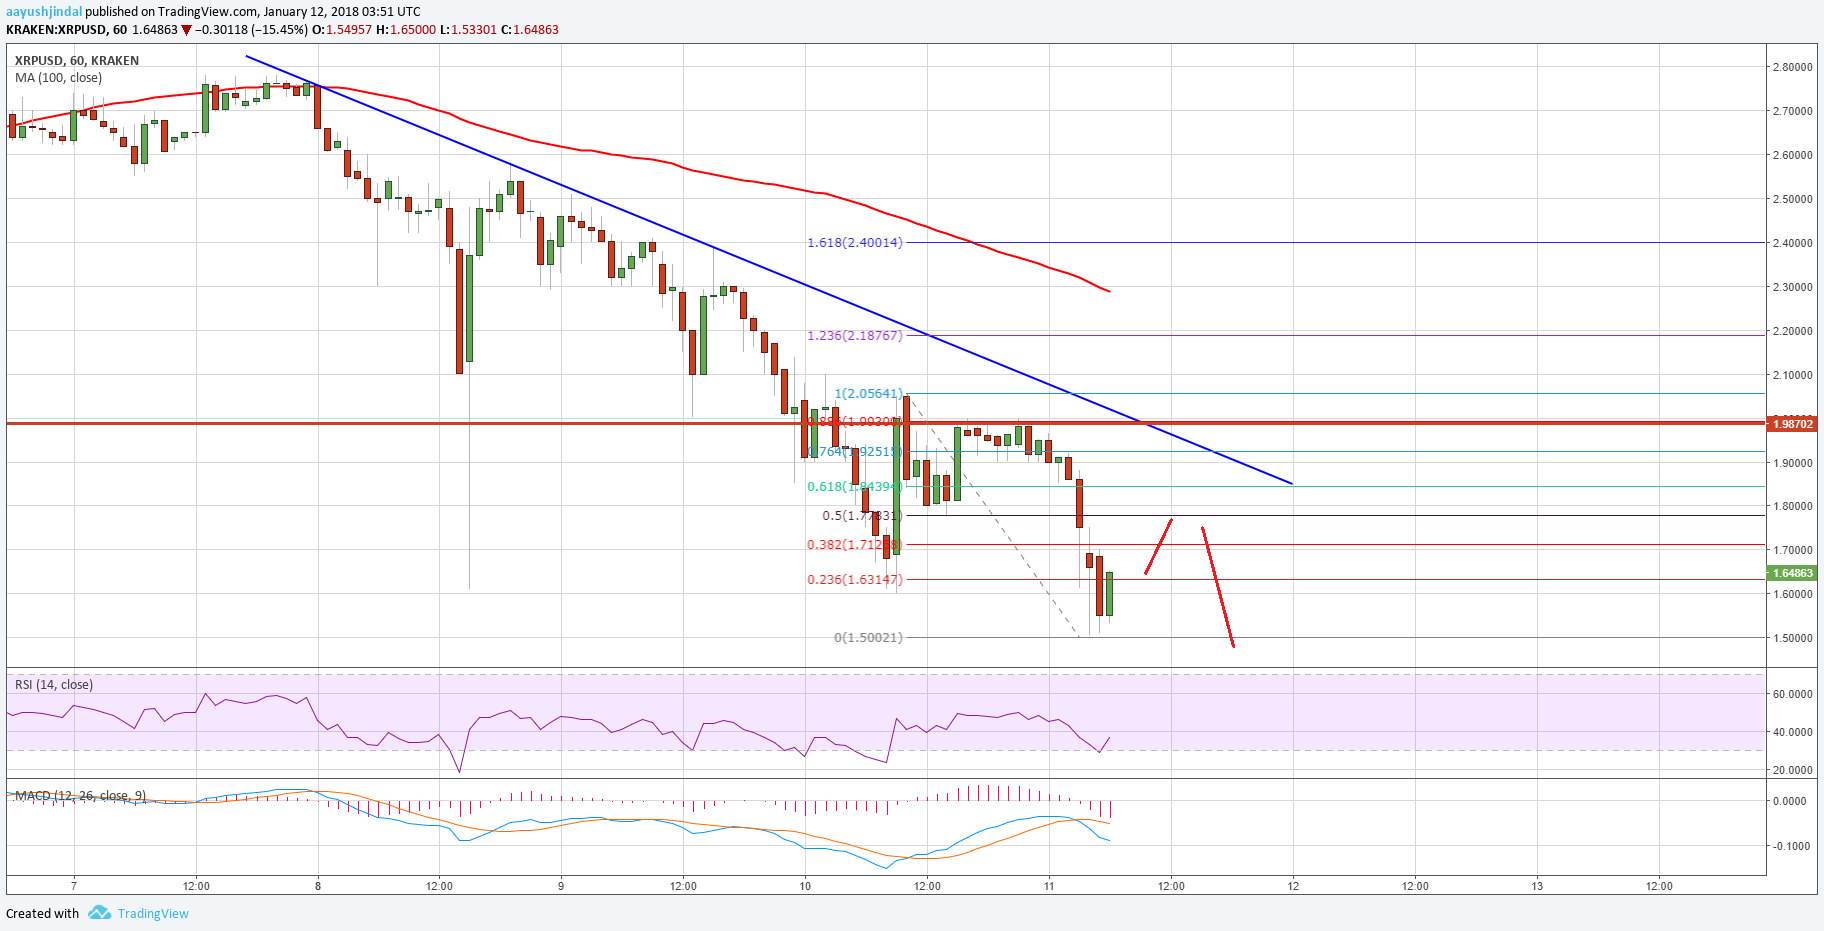
- This week’s highlighted major bearish trend line with current resistance at $1.85 is preventing upsides on the hourly chart of the XRP/USD pair (data source from Kraken).
- The price remains at a risk of more losses as long as it is below the $1.80 level.
Ripple price declined further against the US Dollar and Bitcoin. XRP/USD tested the $1.50 level and it is currently placed in the bearish zone for more declines.
Ripple Price Decline
There was no respite for Ripple price as it extended declines below the $1.75 level against the US Dollar. The price moved down and broke the $1.60 support level as well to trade towards $1.50. A low was formed at $1.5002 and it seems like the current bearish pressure is here to stay. A tiny recovery is underway from $1.50. XRP is currently testing the 23.6% Fib retracement level of the last drop from the $2.05 high to $1.50 low.
There are many resistances on the upside near the $1.75 and $1.80 level. An initial resistance is around the 50% Fib retracement level of the last drop from the $2.05 high to $1.50 low. Moreover, this week’s highlighted major bearish trend line with current resistance at $1.85 is preventing upsides on the hourly chart of the XRP/USD pair. Therefore, there is a clear major resistance forming near $1.80. A break above the $1.80-1.85 levels is needed for buyers to take back the lost control.

On the downside, the recent low of $1.50 is a decent support. XRP must hold $1.50 to avoid further declines toward $1.25 in the near term.
Looking at the technical indicators:
Hourly MACD – The MACD for XRP/USD is currently in the bearish zone.
Hourly RSI (Relative Strength Index) – The RSI for XRP/USD is recovering from the 30 level.
Major Support Level – $1.50
Major Resistance Level – $1.85
Charts courtesy – Trading View, Kraken


Chart is just a tad out of date. Does not account for MoneyGram news and other news to follow in the coming weeks. We’ll see if if trends bearish, but I’m seeing a bottom and reversal, albeit slowly
Dude XRP is already trading at $2.0135 levels. The technicals are out of place.
Dumbest post read today…!!!
People like you are a shame to journalism. NewsBTC should fire you.
You do realize kraken has been down for 2 days. This post is so out of date to have only been released an hour ago.
Looks like this guy just copies articles from other posts. You should have published this yesterday would have made more sense. Price today is way higher than you know. Good luck with your crypto trading.
What a joke.
“XRP must hold $1.50 to avoid further declines toward $1.25 in the near term.” You’re kidding right? You mean if it falls below $1.50 that it’s heading toward $1.25? Are you serious? My god, I never would’ve figured that out had you not pointed it out!
I swear my 10 year old could’ve written this article.
So let your 10 year old manage your finance. Is smarter than you.
What a joke . at least take a bit of time to see how the prices are doing
This post is a real waste of time!!!
Gud.
What a jackass hater !
I dont know which one is worse.
waste of time! always check your information before making public…useless
This article is a repost from days ago. Author must have bet against XRP or something because the price adjustment from South Korean exchanges made prices slip and many exchanged out of XRP at the sight of it dropping. This money will come back and pump XRP up again especially on the MoneyGram news and look for AMEX’s quarterly results to shine light on how much they save with using Ripple and other larger money movers following suit. If companies move money cheaper and faster with Ripple they increase their margins and pump up the bottom line that investors love.
You wrote this a day ago? #DoYouEvenCryptoBro