Reason to trust
How Our News is Made
Strict editorial policy that focuses on accuracy, relevance, and impartiality
Ad discliamer
Morbi pretium leo et nisl aliquam mollis. Quisque arcu lorem, ultricies quis pellentesque nec, ullamcorper eu odio.
Key Highlights
- Ripple price remains in major uptrend above the $0.2350 support against the US Dollar.
- Yesterday’s highlighted ascending channel with current support near $0.2350 is intact on the hourly chart of the XRP/USD pair (data source from Kraken).
- The pair will most likely move further higher towards the 0.2550 and 0.2600 levels.
Ripple price is placed well in the bullish zone against the US Dollar and Bitcoin. XRP/USD might soon retest $0.2600 and it could even break it.
Ripple Price Trend
There were slow and steady gains in Ripple price above $0.2300 against the US Dollar. The price after declining towards $0.2000 found support and since then moved higher. It moved above the 50% Fib retracement level of the last decline from the $0.2680 high to 0.2048 low. The best part is the fact that the price is now placed well above the $0.2300 support and the 100 hourly simple moving average.
More importantly, yesterday’s highlighted ascending channel with current support near $0.2350 is intact on the hourly chart of the XRP/USD pair. The pair is likely to continue moving higher and it might soon test the channel resistance near $0.2550. The stated $0.2550 level also represents the 76.4% Fib retracement level of the last decline from the $0.2680 high to 0.2048 low. Above $0.2550, the pair would easily break the $0.2600 level for more gains in the near term. There are even chances of XRP retesting the last swing high of $0.2650.
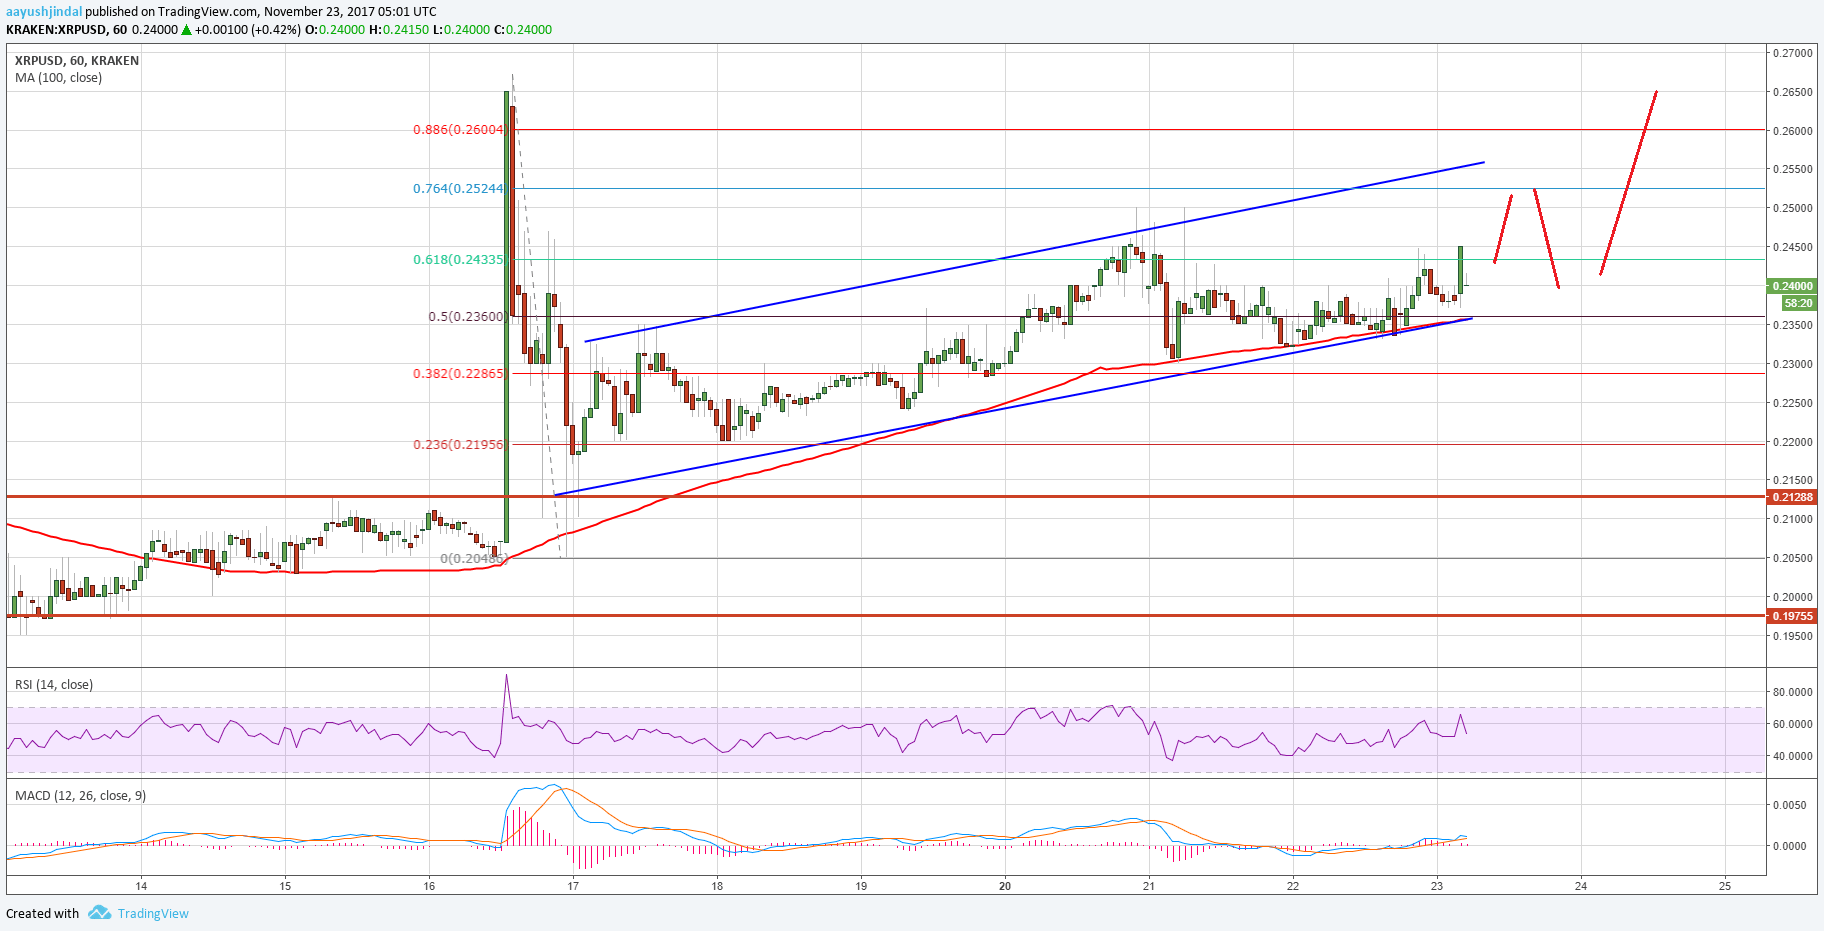
On the downside, the channel support at $0.2350 is very important. The stated $0.2350 support also coincides with the 100 hourly simple moving average. Therefore, $0.2350 and $0.2300 can be considered as a good buy zone as long as the pair is above the 100 hourly SMA.
Looking at the technical indicators:
Hourly MACD – The MACD for XRP/USD is moving nicely in the bearish zone.
Hourly RSI (Relative Strength Index) – The RSI for XRP/USD is above the 50 level and is showing positive signs.
Major Support Level – $0.2350
Major Resistance Level – $0.2550
Charts courtesy – Trading View, Kraken