Key Highlights
- ETH price is trading below the $309 resistance and the 100 simple moving average (H4) against the US Dollar.
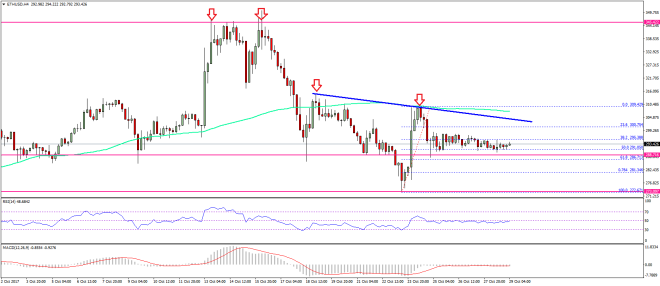
- There is a major bearish trend line forming with resistance at $302 on the 4-hours chart of ETH/USD (data feed via SimpleFX).
- The pair has to break the $302 resistance the 100 SMA (H4) to move back in the bullish zone.
Ethereum price is struggling to gain momentum against the US Dollar and Bitcoin. ETH/USD has to stay above $288 to gain upside momentum.
Ethereum Price Support
This past week was mostly neutral for ETH price above $280 against the US Dollar. The price was seen recovering towards $305-310, but sellers managed to defend further upsides and pushed the price down. At present, the price is consolidating in a range above $288 and preparing for the next move. There was a ride towards $309.50, but the price failed to break the 100 simple moving average (H4).
It moved down once again and broke the 38.2% Fib retracement level of the last wave from the $272.62 low to $309.42 high. However, the downside move was protected by the $292-290 support area. Moreover, the 50% Fib retracement level of the last wave from the $272.62 low to $309.42 high also acted as a support. It seems like the price might continue to trade in a range before the next move. On the upside, there is a major bearish trend line forming with resistance at $302 on the 4-hours chart of ETH/USD.
The trend line resistance near $302-304 is also close to the 100 SMA (H4). That’s why a break above the $302 and $309 levels are required for buyers to gain momentum. On the other hand, a break of the $288 support would call for more declines back towards $272.
4-hours MACD – The MACD is almost flat in the bearish zone.
4-hours RSI – The RSI is currently just below the 50 level.
Major Support Level – $288
Major Resistance Level – $309
Charts courtesy – SimpleFX


