Reason to trust
How Our News is Made
Strict editorial policy that focuses on accuracy, relevance, and impartiality
Ad discliamer
Morbi pretium leo et nisl aliquam mollis. Quisque arcu lorem, ultricies quis pellentesque nec, ullamcorper eu odio.
Key Highlights
- There was a sharp decline in ETH price below the $88 support against the US Dollar.
- A very important bullish trend line with support at $90.00 on the hourly chart (ETH/USD, data feed via SimpleFX) was broken.
- The price is now likely heading towards the next support area at $80.95
Ethereum price nosedived against the US Dollar and Bitcoin amid XRP rise, and now ETH/USD may trade further lower towards the $80.90 zone.
Ethereum Price Major Breakdown
In the last analysis, we discussed that if there is a break below $90 in ETH price against the US Dollar, there can be an extension of losses. The price failed to hold gains and broke the $90 support. The most important move was below yesterday’s highlighted bullish trend line with support at $90.00 on the hourly chart. It opened the doors for more declines, and the price even broke the $88 support.
The downside was with strong momentum, taking the price below the 61.8% Fib retracement level of the last wave from the $83.35 low to $93.49 high. There was a sharp decline and the price even broke the $84 support. Later, there was a close below the last swing low of $83.35. This means the price may now head towards the 1.236 extension of the last wave from the $83.35 low to $93.49 high.
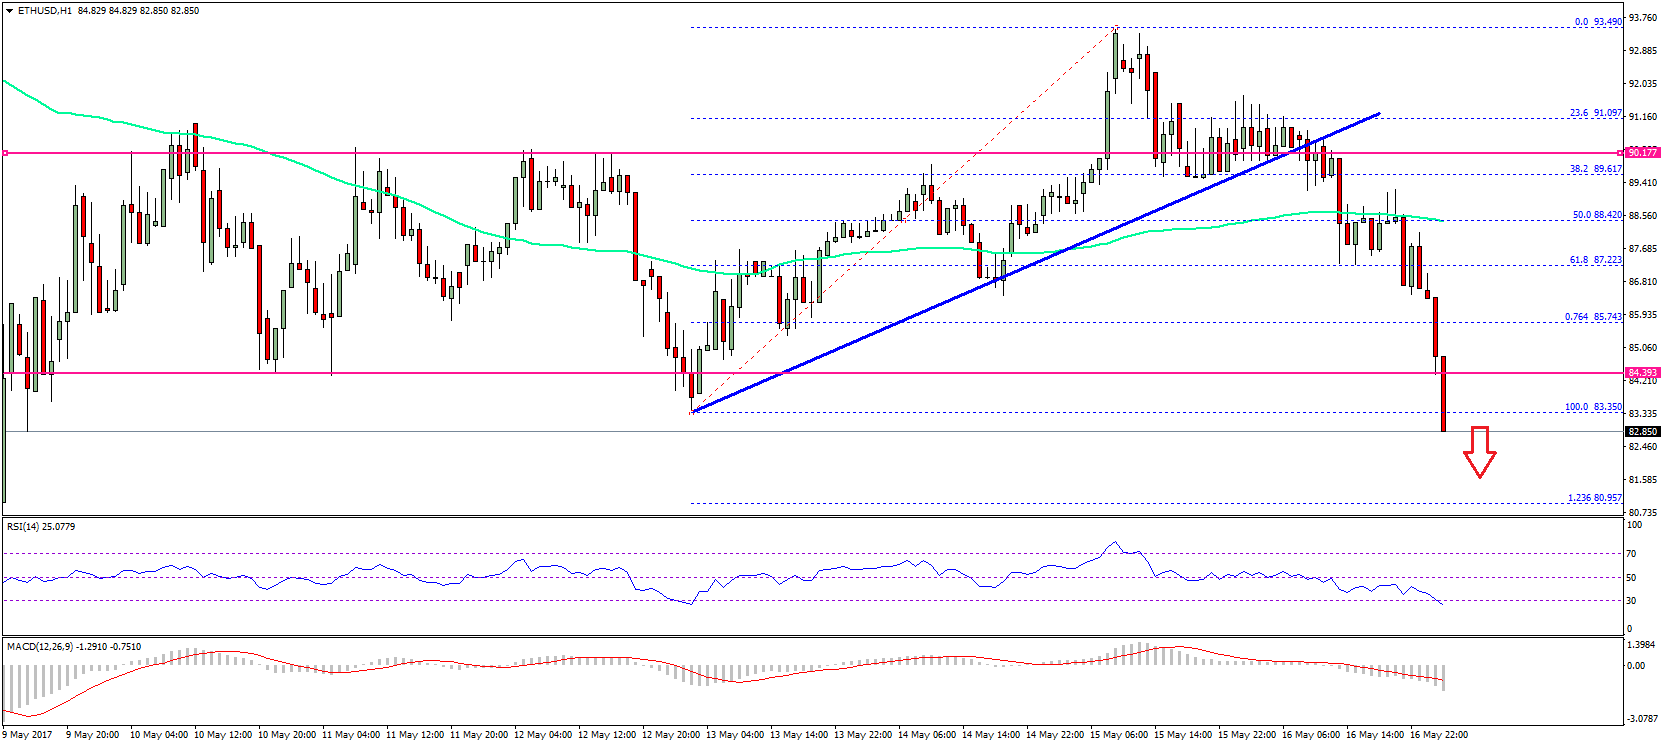
It looks like the ETH sellers are in full control, and may attempt to take the price further lower. There are even chances of ETH/USD testing $80.95 level. On the upside, the broken support at $88.42 and the 100 hourly simple moving average may now act as a resistance. There is a short-term trend change with a break below $85.
Hourly MACD – The MACD has moved sharply in the bearish zone.
Hourly RSI – The RSI is reaching oversold levels at 28.
Major Support Level – $80.95
Major Resistance Level – $88.40
Charts courtesy – SimpleFX