Reason to trust
How Our News is Made
Strict editorial policy that focuses on accuracy, relevance, and impartiality
Ad discliamer
Morbi pretium leo et nisl aliquam mollis. Quisque arcu lorem, ultricies quis pellentesque nec, ullamcorper eu odio.
Key Highlights
- There was a continuous bid pattern near $86 in ETH price against the US Dollar, which is a good sign.
- The range pattern highlighted in the last analysis with support at $84.50 and resistance near $91 is still active on the hourly chart (ETH/USD, data feed via SimpleFX).
- A break and close above the $91 level may call for sustained gains in the near term.
Ethereum price continues to trade in a range against the US Dollar and Bitcoin, but the underlying trend remains bullish for ETH/USD above $85.
Ethereum Price Range
In the last analysis, we saw how ETH price formed a base near $86 against the US Dollar. There was also a major range pattern with support at $84.50 and resistance near $91 formed on the hourly chart of ETH/USD. The same range pattern is still active, and playing a major role. The price is currently well above the 100 hourly simple moving average at $88, which is a positive sign.
On the upside, the range resistance is near $91, which acted as a hurdle on many occasions. A break above it is needed for a move towards $100. On the downside, there is a connecting bullish trend line at $85.80 on the hourly chart. Below $85.80, there is a support near $84.20 which is the range support. It also coincides with the 38.2% Fib retracement level of the last wave from the $69.24 swing low to $90.98 high.
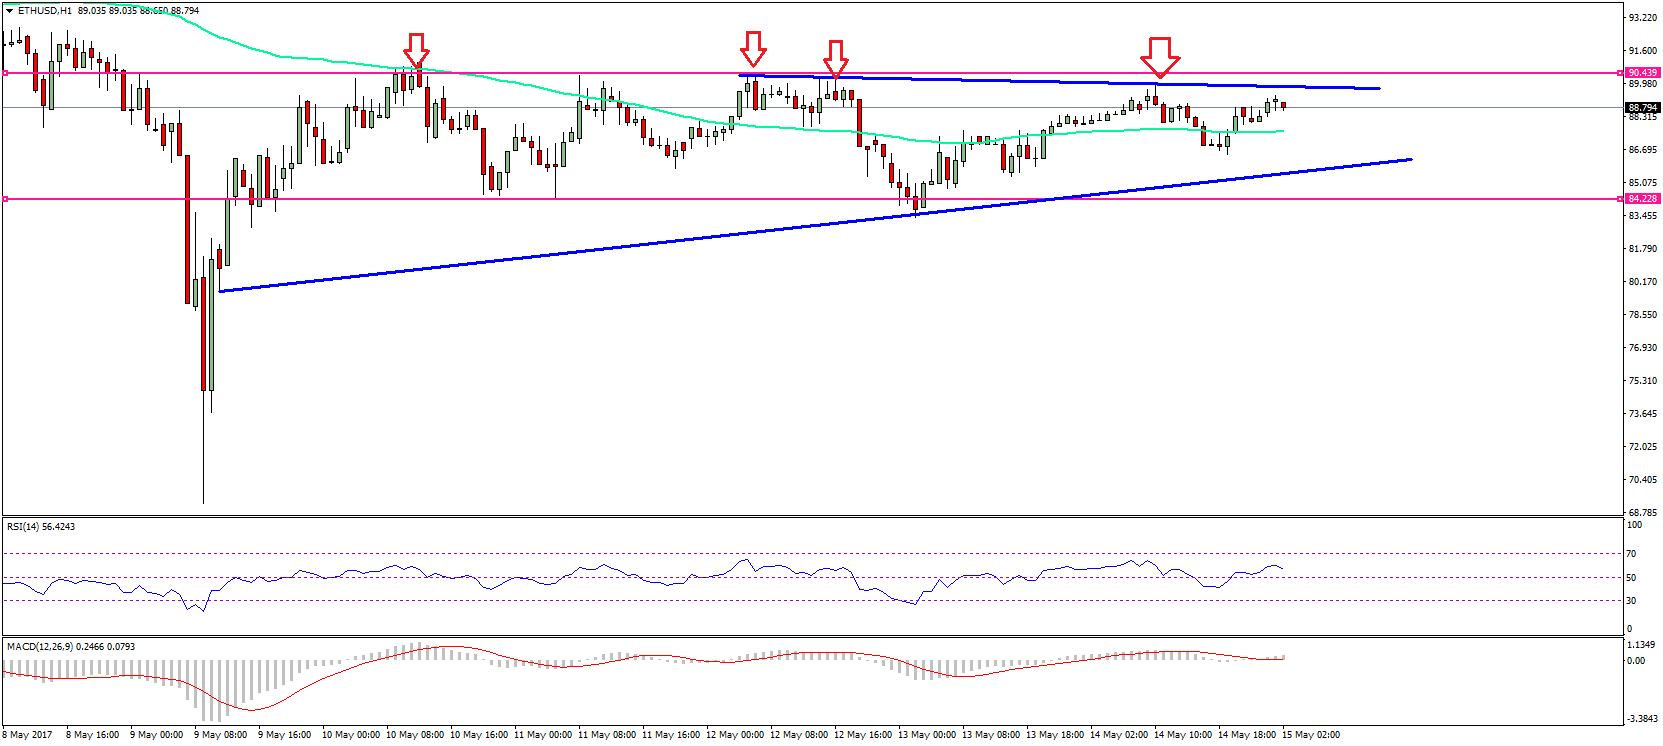
On the upside, we need a break above $91, but it won’t be easy. The current momentum is with buyers as long as the price is above $85. A break below the range support at $85 won’t be good, and may call for a change in the trend.
Hourly MACD – The MACD is not moving much, and suggesting a range pattern.
Hourly RSI – The RSI is just above the 50 level and moving higher.
Major Support Level – $85
Major Resistance Level – $91
Charts courtesy – SimpleFX