
Reason to trust
How Our News is Made
Strict editorial policy that focuses on accuracy, relevance, and impartiality
Ad discliamer
Morbi pretium leo et nisl aliquam mollis. Quisque arcu lorem, ultricies quis pellentesque nec, ullamcorper eu odio.
Key Highlights
- There were was a minor dip in ETH price towards $85 against the US Dollar, but later it recovered.
- There is a major connecting bearish trend line with resistance at $96.83 formed on the hourly chart (ETH/USD, data feed via SimpleFX).
- The price may dip once again, but likely to find support near the $92 level.
Ethereum price remained in the bullish zone against the US Dollar and Bitcoin, and ETH/USD is now once again preparing for the next move.
Ethereum Price Resistance
There were a few moves in ETH price as it dipped below the $90 level against the US Dollar. We can say that the price started a correction from the $100 swing high towards the $85.00 level. A low was formed near $84.60 from where a recovery was started. The price moved higher, and traded above the 23.6% Fib retracement level of the last decline from the $100.60 high to $84.60 low. There was a connecting bullish trend line at $85, which prevented further losses and pushed the price higher.
The price is now back above the 50% Fib retracement level of the last decline from the $100.60 high to $84.60 low. It may continue to trade higher. However, there is a major connecting bearish trend line with resistance at $96.80 formed on the hourly chart of ETH/USD. It may act as a hurdle and prevent gains above $96.
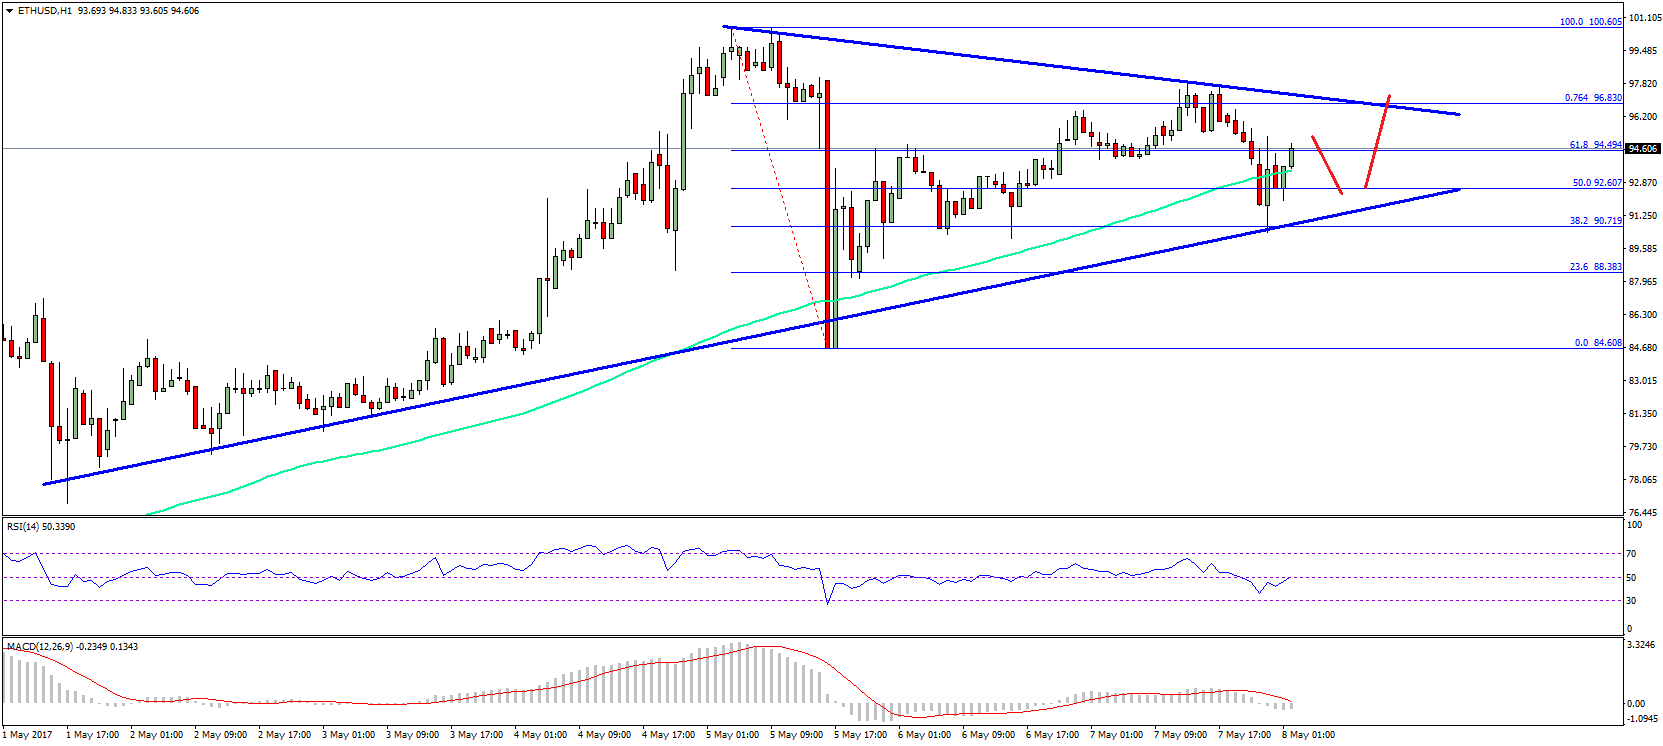
The same trend line also coincides with the 76.4% Fib retracement level of the last decline from the $100.60 high to $84.60 low. So, there can be a minor dip in ETH price before it makes another upside move above $96.
Hourly MACD – The MACD is just moving from the bearish to bullish zone.
Hourly RSI – The RSI is currently moving higher, and attempting to settle above the 50 level.
Major Support Level – $92
Major Resistance Level – $96
Charts courtesy – SimpleFX


