Reason to trust
How Our News is Made
Strict editorial policy that focuses on accuracy, relevance, and impartiality
Ad discliamer
Morbi pretium leo et nisl aliquam mollis. Quisque arcu lorem, ultricies quis pellentesque nec, ullamcorper eu odio.
Key Highlights
- Ethereum price managed to start a recovery after trading as low as $5.68 against the US Dollar.
- The current recovery is facing resistance near a major bearish trend line formed on the daily chart of ETH/USD (data feed via SimpleFX).
- A break above the highlighted trend line resistance may ignite an upside move.
Ethereum price is recovering well at the moment against the US dollar and Bitcoin, but also reaching a major pivot area.
Ethereum Price Hurdle
There was a major decline in Ethereum price against the US Dollar and BTC before starting a recovery. ETH/USD traded as low as $5.68 where the buyers appeared and started a recovery. There was a move above the 23.6% Fib retracement level of the last decline from the $12.68 high to $5.68 low. It means there is a chance of further gains in the near term if the buyers remain in control.
There is a major bearish trend line formed on the daily chart of ETH/USD (data feed via SimpleFX). It is currently acting as a resistance and preventing an upside move. Moreover, the 38.2% Fib retracement level of the last decline from the $12.68 high to $5.68 low is also acting as a resistance. It looks like the price is finding it very hard to break the trend line resistance.
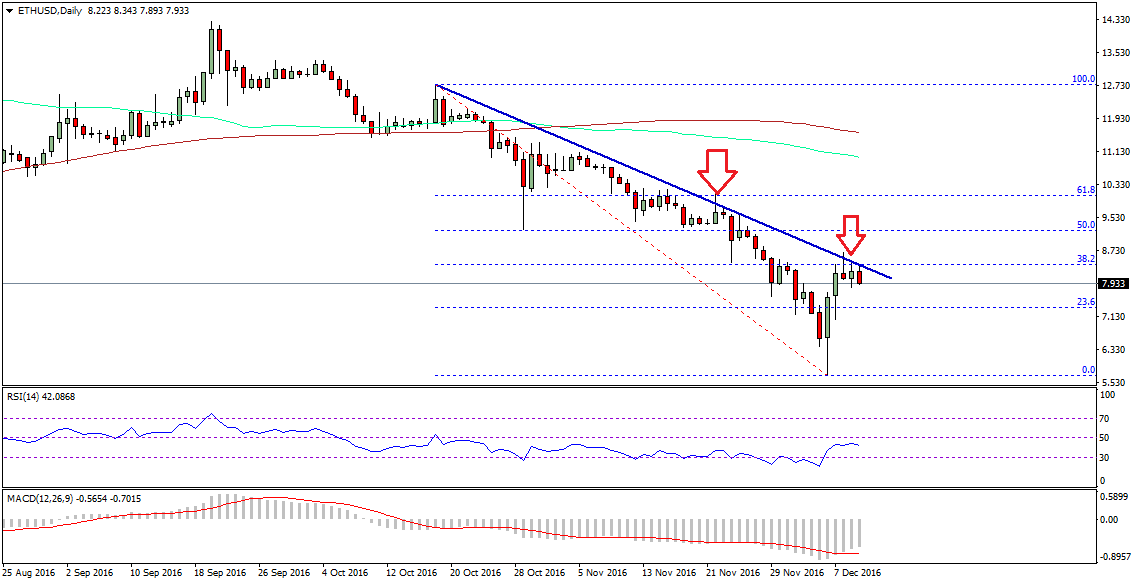
If there is a break above the trend line, then there are chances of further gains in the short term. The next stop for the buyers could be around the $9.20 level. On the downside, the $7.50 level is a key support, and may act as a barrier for a break down.
Daily MACD – The MACD is still in the bearish zone, which is a concern for the ETH buyers.
Daily RSI – The RSI has recovered well from the negative zone, but still below the 50 level.
Major Support Level – $7.50
Major Resistance Level – $8.50
Charts courtesy – SimpleFX