
Reason to trust
How Our News is Made
Strict editorial policy that focuses on accuracy, relevance, and impartiality
Ad discliamer
Morbi pretium leo et nisl aliquam mollis. Quisque arcu lorem, ultricies quis pellentesque nec, ullamcorper eu odio.
Key Highlights
- ETH price after moving as high as $317 against the US Dollar found resistance and started a correction.
- The ETH/USD pair is currently attempting a break below a bullish trend line with support at $284 on the hourly chart (data feed via SimpleFX).
- There is a chance that the price may move down and test the $266 support zone.
Ethereum price has started a correction against the US Dollar and Bitcoin, and now ETH/USD may move down and test the 100 SMA or $266.
Ethereum Price Support
Recently, we saw a rise in ETH price above $300 against the US Dollar. A new weekly high was formed near $317 where sellers emerged and pushed the price lower. It looks like a correction wave is initialized and the price may decline towards $270-260. It is currently below the 23.6% Fib retracement level of the last wave from the $202 low to $317 high.
At the moment, the ETH/USD pair is currently attempting a break below a bullish trend line with support at $284 on the hourly chart. It the pair succeeds in a close below the trend line support at $284, there are chances of more declines in the near term. The next support is around the 38.2% Fib retracement level of the last wave from the $202 low to $317 high at $273. However, the most important support is near the 100 hourly simple moving average at $266.
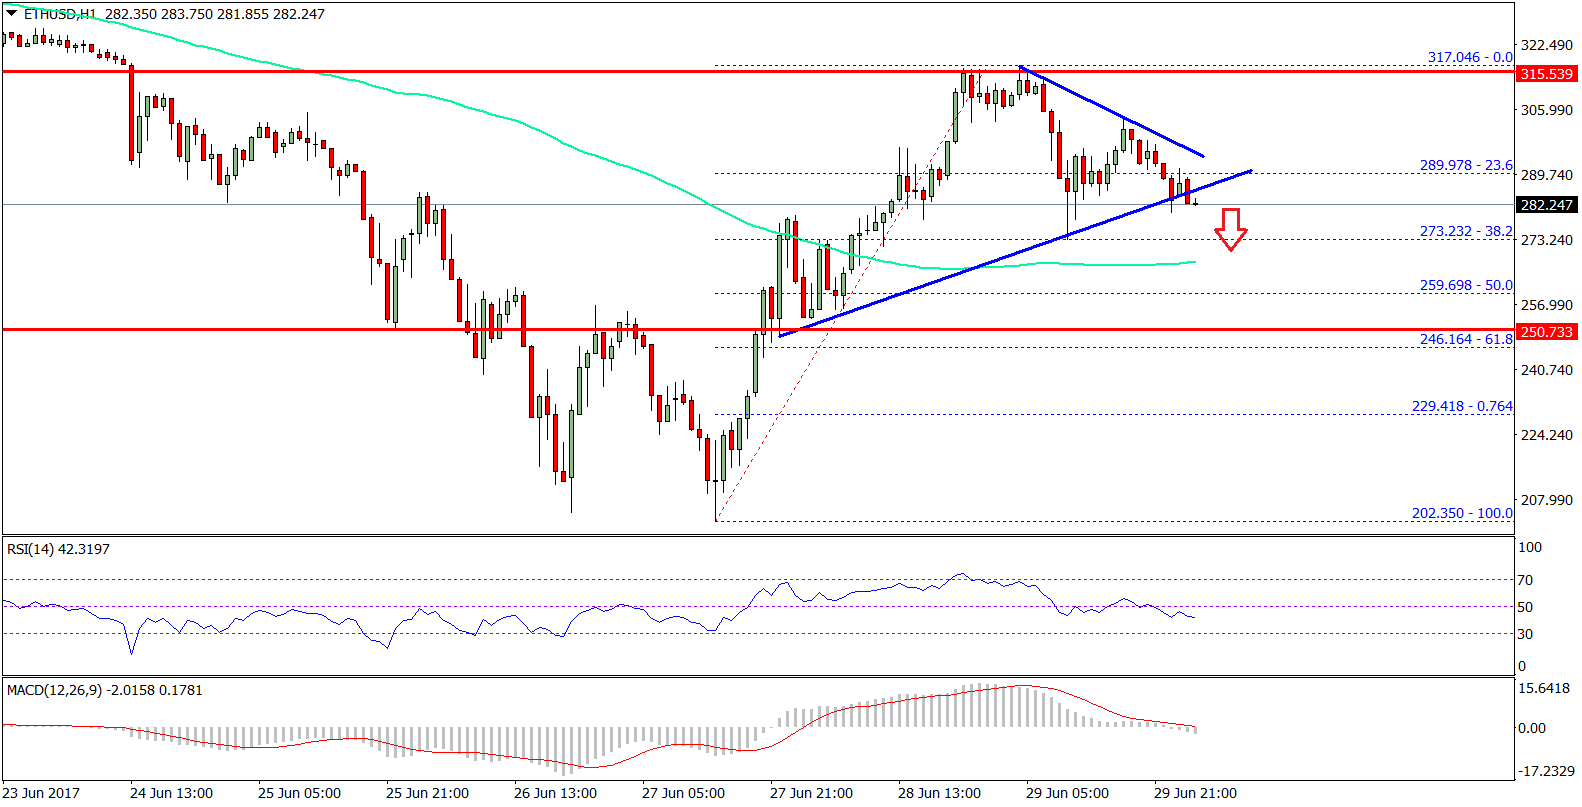
Any further declines or corrections should be limited by the 50% Fib retracement level of the last wave from the $202 low to $317 high. On the upside, the there is a minor connecting bearish trend line at $292. It may act as a short-term hurdle for gains above $300.
Hourly MACD – The MACD is slowly moving into the bearish zone.
Hourly RSI – The RSI is now below the 50 level and heading lower.
Major Support Level – $266
Major Resistance Level – $292
Charts courtesy – SimpleFX


