Key Highlights
-
- ETH price nosedived against the US Dollar yesterday, and broke an important support area of $9.50-40.
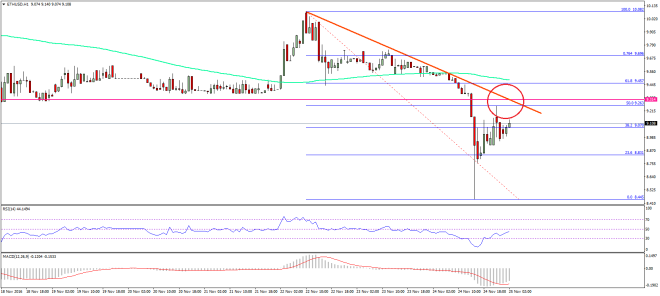
- Yesterday’s highlighted bullish trend line on the hourly chart (data feed via SimpleFX) of ETH/USD was broken to clear the way for more declines.
- A new weekly low of $8.44 was formed before the price started to recover.
Ethereum price crashed yesterday due to the report of consensus bug in geth v1.4.19. ETH/USD broke an important support to trade below $9.00.
Ethereum Price Decline
A consensus bug in geth v1.4.19 was reported yesterday due to which geth was failing to revert empty account deletions when the transaction causing the deletions of empty accounts, as published on the official blog. It ignited a downside move, taking the price down from $9.50 to $8.50. During the downside move, the price broke yesterday’s highlighted bullish trend line on the hourly chart (data feed via SimpleFX) of ETH/USD.
Also, the price moved below an important support area of $9.50-40, which accelerated the downside move. The price traded below $9.00 and formed a new weekly low of $8.44. A recovery was started from the mentioned level, as the price moved above the 23.6% Fib retracement level of the decline from the $10.08 high to $8.44 low. However, the upside failed right at the 50% Fib level of the same wave.

There is also a bearish trend line formed on the same chart, which is acting as a resistance and preventing an upside move. It looks like there is a chance of another dip in ETH before the price starts to post healthy recovery. Buying should be avoided in the short term.
Hourly MACD – The MACD is now strongly in the bearish slope, and pointing more losses.
Hourly RSI – The RSI is currently recovering from the oversold readings and heading north.
Major Support Level – $8.80
Major Resistance Level – $9.25
Charts courtesy – SimpleFX


