Reason to trust
How Our News is Made
Strict editorial policy that focuses on accuracy, relevance, and impartiality
Ad discliamer
Morbi pretium leo et nisl aliquam mollis. Quisque arcu lorem, ultricies quis pellentesque nec, ullamcorper eu odio.
Key Highlights
- ETH price declined further versus the US Dollar, and traded as low as $11.46.
- There is a new short-term bearish trend line formed on the hourly chart (data feed via SimpleFX) of ETH/USD, which may provide a relief rally.
- The pair is finding support near $11.50, which may produce a bounce in the short term.
Ethereum price extended the downside move against the US Dollar to test $11.50. Let’s see if the price can recover moving ahead or not.
Ethereum Price Resistance
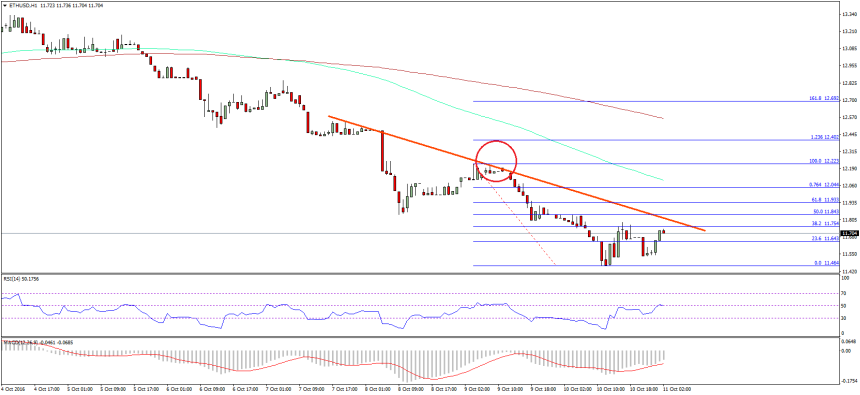
Ethereum price broke down further as sellers remained in action. There was a break below the $11.60 support area for a move towards $11.50. Once again a new weekly low was formed at $11.46. The price was seen correcting higher yesterday, but it found sellers near $12.10. I was correct when I called for a test of the 1.618 extension of the last swing from the $11.84 low to $12.28 high. The price not only tested it, but also broke it for a new low.
The ETH/USD pair is once again attempting a recovery, and already moved above the 23.6% Fib retracement level of the last drop from the $12.22 high to $11.46 low. So, there is a chance of more upsides in the near term. On the upside, there a new short-term bearish trend line formed on the hourly chart (data feed via SimpleFX) of ETH/USD. It may be seen as a resistance along with the 50% Fib retracement level of the last drop from the $12.22 high to $11.46 low.
However, there is a chance of a break above the trend line resistance, which may open the doors for a recovery.
Hourly MACD – The MACD is currently in the bearish zone, but attempting to decrease the pressure.
Hourly RSI – The RSI is attempting to move above the 50 level, which is a positive sign.
Major Support Level – $11.50
Major Resistance Level – $11.90
Charts courtesy – SimpleFX