Reason to trust
How Our News is Made
Strict editorial policy that focuses on accuracy, relevance, and impartiality
Ad discliamer
Morbi pretium leo et nisl aliquam mollis. Quisque arcu lorem, ultricies quis pellentesque nec, ullamcorper eu odio.
Key Highlights
- Ethereum price suffered heavy losses this past week against the US Dollar, and almost every major rally was sold.
- There is a contracting triangle pattern formed on the 4-hours chart (data feed via Kraken) of ETH/USD, which may provide us the next break.
- The price is below the 100 simple moving average (H4), which is a bearish sign and a concern for the bulls.
Ethereum price remained under a bearish pressure this past week, and it looks like ETH may continue to face offers in the near term.
Ethereum Price Break
Ethereum price ETH faced a lot of sellers this past week against the US Dollar, as a crucial resistance area at $14.00 acted as a hurdle and ignited a downside move. The price traded towards the $11.00 level where it found support and started consolidating losses. There is currently a contracting triangle pattern formed on the 4-hours chart (data feed via Kraken) of ETH/USD, which holds the key for the next move.
On the upside, an initial resistance is around the 23.6% Fib retracement level of the last drop from the $16.10 high to $11.32 low. However, the most important one is around the triangle resistance area, which may act as a major barrier for the bulls. A break above it could take the price towards the 100 simple moving average (H4 chart).
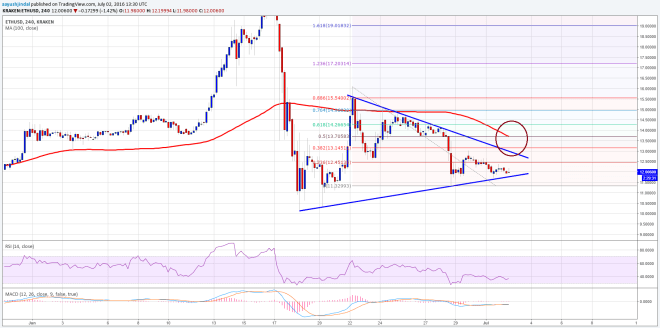
On the downside, if the ETH bears manage to break the triangle support area, then a move towards the $10.00 level is possible. I think, we need to wait for the price to complete consolidation, and then breaks either higher or lower to catch the next move.
4-hours MACD – The MACD is in the bearish slope, which is negative sign for the bulls.
4-hours RSI – The RSI is below the mid-range, calling for a bearish bias in the short term.
Major Support Level – $11.00
Major Resistance Level – $13.00
Charts courtesy of Kraken via Trading View