Key Highlights
- Ethereum price started to move higher once again vs the US dollar, and it looks like my yesterday’s idea of a test $20.0 is possible.
- There is now a channel pattern forming on the hourly chart (data feed via Kraken) of ETH/USD, which may act as a catalyst for the upside move.
- If the current momentum continues, there is a chance of an upside move towards $20.00.
Ethereum price retained the bullish bias after a minor correction, and the current price action in ETH suggests more gains in the short term.
Ethereum Price Upside Move
Ethereum price ETH after trading towards the $17.70 support area against the US Dollar started to climb higher once again. The price is currently trading near the 61.8% Fib retracement level of the last drop from the $19.30 high to $16.09 low, and almost broke it. There is also a channel pattern forming on the hourly chart (data feed via Kraken) of ETH/USD, which may play a major role for the next move in the short term.
If the price continues to trade higher from the current levels, then the all-important $20.00 level may be tested. The stated level also coincides with the 1.236 extension of the last drop from the $19.30 high to $16.09 low, which is a perfect technical level.
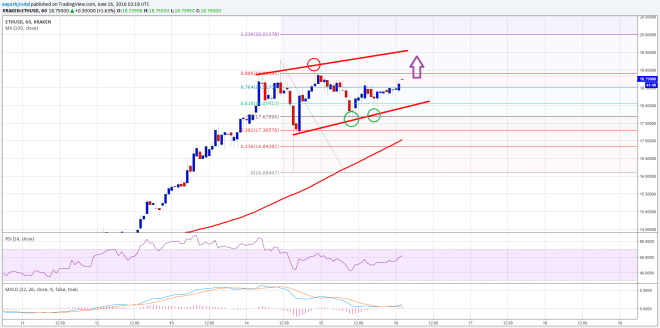
ETH/USD is also well above the 100 hourly simple moving average, which is a positive sign and could ignite further gains. An initial hurdle on the upside is around the $19.00 level, followed by $19.20. On the downside, the channel support trend line may be considered as a buy zone with a stop below it.
Hourly MACD – The MACD is back into the bullish zone, signaling more gains in ETH.
Hourly RSI – The RSI is above the 50 level, which is a bullish sign for the ETH buyers.
Major Support Level – $18.05
Major Resistance Level – $19.00
Charts courtesy of Kraken via Trading View