Key Highlights
- Bitcoin price formed a major support area around $370-75 where it found buyers and started to trade higher.
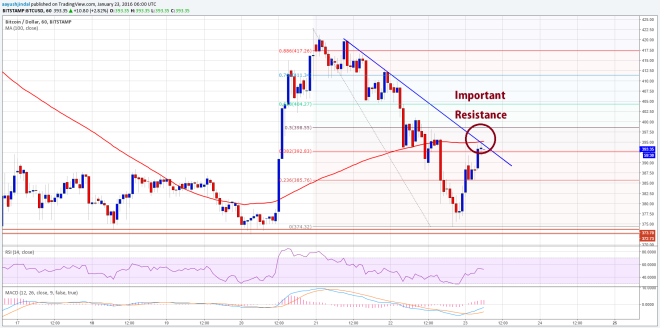
- The price is currently trading near a crucial bearish trend line on the hourly chart via the data feed from Bitstamp, which is acting as a monster resistance.
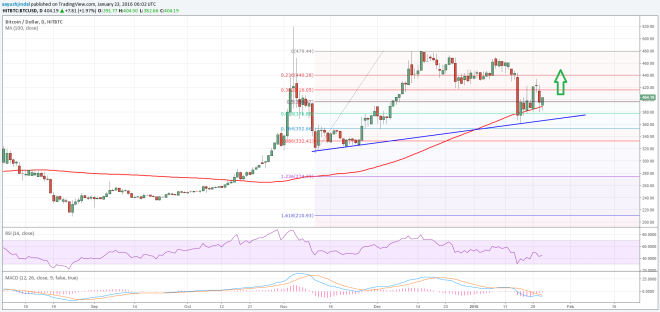
- On the daily chart with the data feed from HitBTC, the price settled above the 100-day simple moving average, which is calling for more upsides in the near term.
Bitcoin price is facing a tough resistance on the hourly chart, but looking at the daily chart there are many bullish signs calling for gains moving ahead.
Break Ahead?
If we start by looking at the higher timeframe, then it looks like Bitcoin price passed an important test this past week. There was a major support trend line formed on the daily chart via the data feed from HitBTC, which acted as a barrier for sellers and prevented a downside move. The most important point is that the price was seen struggling near the 100-day simple moving average (daily chart via the data feed from HitBTC), but finally it managed to close the week above it. The price also tested the 61.8% Fib retracement level of the last wave from the $313 low to $479 high, which in fact was breached by sellers.

However, the support trend line played well and prevented a downside break along with the 76.4% Fib retracement level of the last wave from the $313 low to $479 high. If all goes well, then there is a chance that the price may climb higher and trade near the $420 area, which can be considered as an initial resistance on the upside. Any further gains may take the price towards the next resistance area at $440.
Now, let’s drop on the lower timeframe and check what the price can do in the short term. There is a monster resistance forming near a bearish trend line on the hourly chart via the data feed from Bitstamp. The highlighted trend line and resistance area is very crucial, as it represents a confluence area. A confluence of the 100 hourly simple moving average (hourly chart via the data feed from Bitstamp) and the 38.2% Fib retracement level of the last drop from the $422 high to $374 low. So, there is a high probability that the price may struggle to break the highlighted trend line and confluence resistance area. If at all buyers succeed in breaking the resistance zone, then a move towards the 50% Fib retracement level of the last drop from the $422 high to $374 low is possible.

However, since we see many positive signs on the daily chart, there is a chance of a break higher. The most important resistance looking at the hourly chart can be around the 76.4% Fib retracement level of the last drop from the $422 high to $374 low at $411.
Looking at the indicators:
Daily MACD – The daily MACD may change the slope to the bearish zone, which may ignite a rally.
RSI (Relative Strength Index) – The daily RSI is below the 50 level, which is not a good sign for bulls.
Intraday Support Level – $375
Intraday Resistance Level – $410
Charts from HitBTC and Bitstamp; hosted by Trading View


