Key Highlights
- There was no stopping the DigitalNote price, as it continued to trade lower and fell below the last swing low of 0.00000070BTC.
- The price traded as low as 0.000000482BTC, where it found buyers for a short-term recovery.
- A correction won’t be easy moving ahead as there are many hurdles on the way up.
DigitalNote price fell sharply and lost a lot of ground to trade below a key support around 0.00000060BTC.
Rejection around 0.00000050BTC?
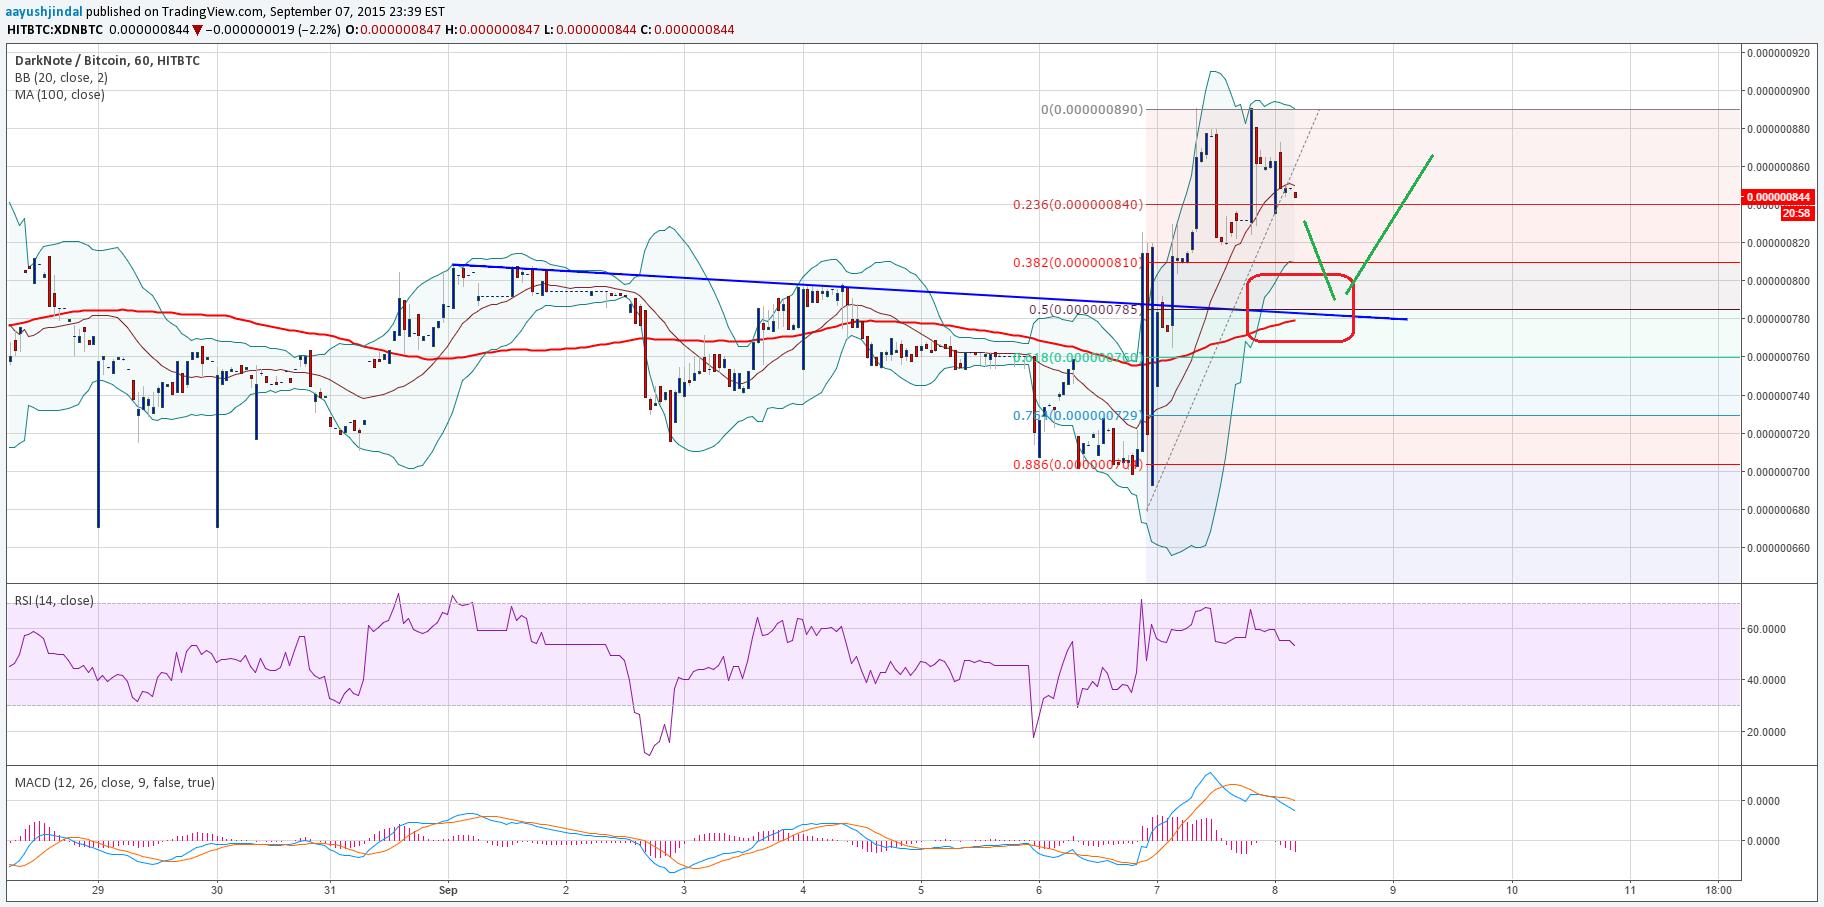
The DigitalNote price collapsed recently and failed to recover after testing our final sell target of 0.00000075BTC. The price continued to trade lower and even broke 0.00000070BTC. The downside was very sharp, taking the price below 0.00000050BTC for a low of 0.000000482BTC. There was a solid buying interest noted around the mentioned level, which ignited an upside reaction. A bullish engulfing candle was also formed on the hourly chart, signaling a complete rejection around the stated level.

However, the bullish engulfing pattern cannot be considered as a reversal signal, as there are many hurdles on the way up for buyers. There is a bearish trend line formed on the hourly chart, which is positioned with the 100 hourly simple moving average to act as a barrier in the near term. Moreover, the 50% Fib retracement level of the last drop from the 0.00000088BTC to 0.000000482BTC is also aligned around the highlighted trend line and resistance area. In short, there is a major hurdle formed around 0.00000070BTC, and it won’t be easy for buyers to break it.
On the downside, the lower Bollinger Band around 0.00000055BTC might act as a support, followed by the last low of 0.000000482BTC.
Intraday Support Level – 0.00000055BTC
Intraday Resistance Level – 0.00000070BTC
The hourly RSI and MACD are positioned in the bullish zone, which is a positive sign.
Charts courtesy of Trading View


Nice bear, bulls are on the way 🙂