Key Highlights
- DarkNote price struggling to clear an important resistance area around 0.00000090 BTC.
- There is a bullish trend line formed on the hourly chart, acting as a support in the near term.
- If there is a break below the support trend line, the price might head towards 0.00000075 BTC.
DarkNote price is trading near a major swing area, which if breached might ignite losses moving ahead.
Can sellers make it?
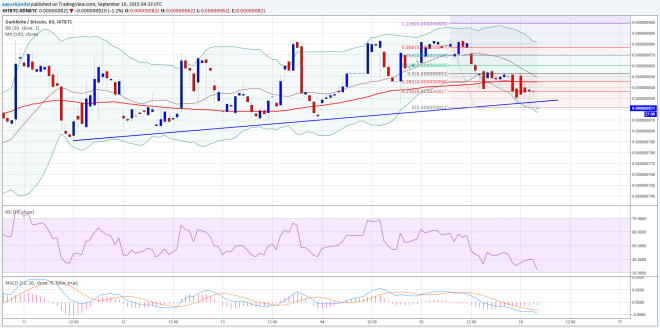
There was a nice upside move this past week in the DarkNote price, but we noticed that buyers failed to break a critical area around 0.00000090BTC. There were a few attempts to clear the mentioned area this week, but sellers managed to defend the stated level successfully. There is now a bullish trend line formed on the hourly chart, which is currently preventing losses and keeping buyers in check.

There are a few bearish signs emerging on the hourly chart, as the price is below the 100 hourly simple moving average. Moreover, the Bollinger Bands also started to bend, showing that sellers started to jump in. if there is a break and close below the trend line and support area, then a chance of move towards 0.00000075BTC might increase.
On the other hand, if the price moves higher, then an initial hurdle lies around the 100 hourly SMA. The stated MA is sitting pretty around the 38.2% fib retracement level of the last drop from the 0.00000088BTC to 0.000000822BTC. A break above the mentioned fib level could ignite a move towards the next hurdle around the 50% Fib level. Any further gains might be limited as long as the price is below the aa-important 0.00000090BTC.
Intraday Support Level – 0.00000082BTC
Intraday Resistance Level – 0.00000090BTC
The hourly RSI is around the oversold area, so there is a possibility of a minor recovery.
Charts courtesy of Trading View


